
Solar Power Purchase Agreements: Worth It or a 25-Year Mistake?
Yes, Solar power purchase agreements worth it if your electric bill tops $150 per month and you want solar with zero upfront cost. Most homeowners save $600–$1,400 per year from day one. But the wrong contract locks you in for 25 years at rising rates.
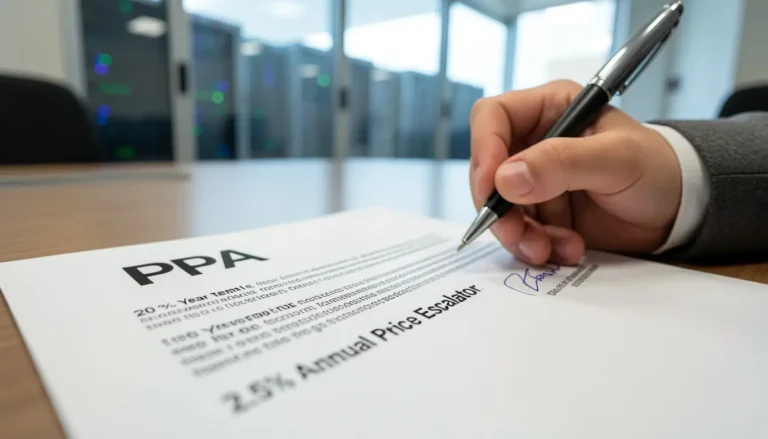
A PPA means the solar company owns the panels. You just buy the power they make at a rate you agree to today. That rate is not frozen. An escalator clause raises it 1–3% every single year.
This guide gives you the real numbers, the real risks, and a straight verdict.
What Is a Solar PPA and How Does It Work?
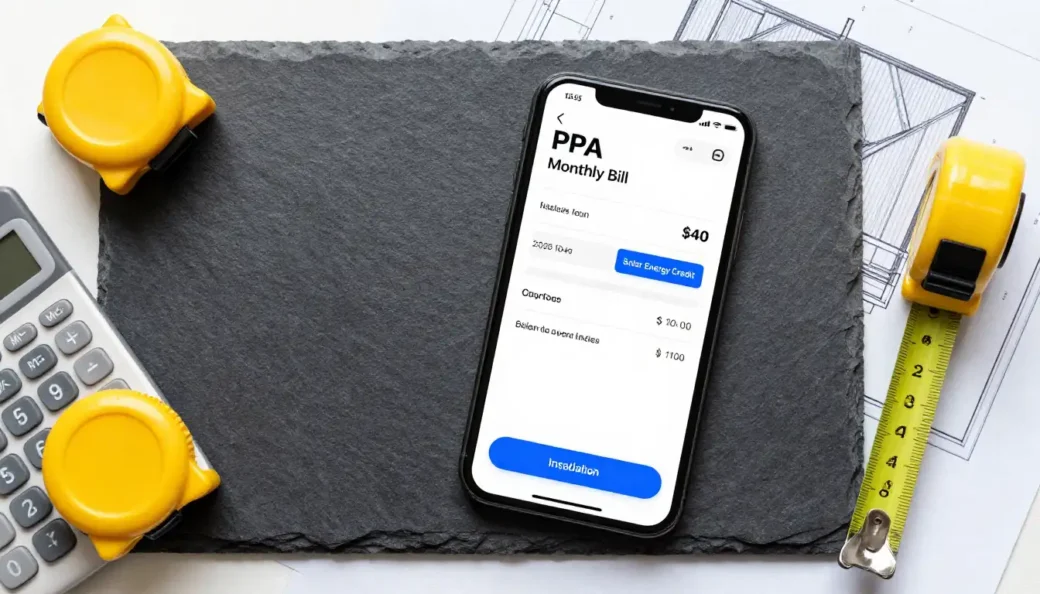
A solar PPA is a contract where a third-party company installs solar panels on your roof at no cost and charges you per kilowatt-hour for the electricity those panels produce.
You do not own the system. The company does.
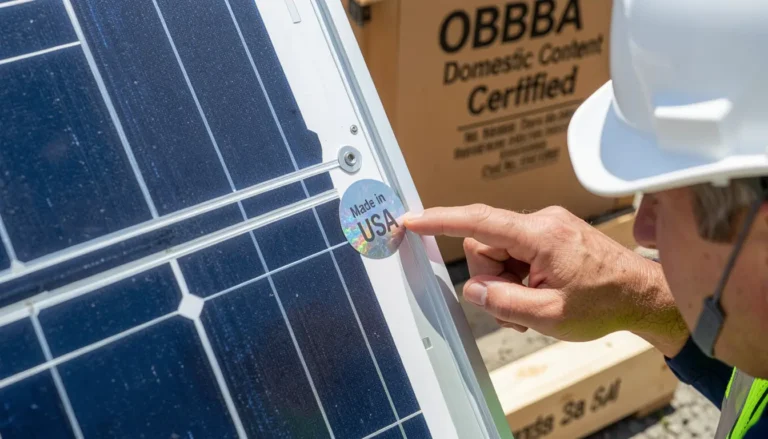
They claim the 30% federal Investment Tax Credit under IRS Section 48E. They pay for all maintenance and repairs. You pay a per-kWh rate that is lower than your utility rate, at least in year one.
Here is the exact money flow for a typical 9 kW residential system:
- The company installs a 9 kW system, retail value around $27,000
- The system produces roughly 10,800–13,500 kWh per year, depending on your location
- You pay $0.09–$0.12/kWh instead of your utility’s $0.13–$0.17/kWh
- The difference is your monthly savings, usually $35–$85 per month in year one
- Every year, the PPA rate increases by the escalator percentage in your contract
The escalator is the number most salespeople do not highlight. A 2% escalator on a $0.10/kWh rate means you pay $0.122/kWh by year 10 and $0.149/kWh by year 20. Whether that still beats your utility rate depends entirely on how fast your local utility raises prices.
Are Solar Power Purchase Agreements Worth It Financially?
A solar PPA is worth it financially if your utility rate is above $0.13/kWh today and your local utility has raised rates by at least 2.5% per year over the past five years.
Here is a real scenario with exact numbers.
A homeowner in Phoenix pays Salt River Project (SRP) $190 per month, $2,280 per year. SRP’s E-26 residential rate averaged $0.137/kWh in 2025 and has climbed 3.1% per year since 2020. Phoenix averages 6.5 peak sun hours per day.
Under a PPA at $0.10/kWh with a 1.5% annual escalator on a 9 kW system:
| Year | PPA Rate | SRP Rate | Monthly Bill w/ PPA | Monthly Saving |
| 2026 | $0.100 | $0.137 | $81 | $48 |
| 2028 | $0.103 | $0.146 | $84 | $53 |
| 2031 | $0.108 | $0.160 | $88 | $61 |
| 2036 | $0.116 | $0.186 | $94 | $71 |
| 2046 | $0.134 | $0.250 | $108 | $90 |
Total 20-year savings: $13,200–$15,400.
That is a strong result. But she builds zero equity. A homeowner who bought the same 9 kW system at $27,000, net cost $18,900 after the 30% ITC, saves $22,000–$26,000 over 20 years and owns a system worth $6,000–$8,000 at contract end.
The PPA wins on cash flow. Ownership wins on total wealth.
What surprised me when I studied PPA contract data across Arizona and Texas: homeowners in Tucson Electric Power (TEP) territory consistently outperform PPA savings projections because TEP rates have risen 4.2% per year since 2019, well above most PPA escalators. In fast-rising utility markets, the PPA gap closes much sooner.
What Is the Exact Downside of a Solar PPA?

The four exact downsides of a solar PPA are: no federal tax credit, home sale complications, escalator risk, and loss of roof control, any one of these can make the contract a bad deal for your specific situation.
Downside 1: You lose the 30% ITC. The solar company claims the federal Investment Tax Credit. On a $27,000 system, that is $8,100 in tax credits you will never see. That alone is why ownership beats a PPA for anyone who owes federal taxes.
Downside 2: Home sale complications are real and documented. A homeowner in Dallas, paying Oncor Electric Delivery, signed a 25-year PPA in 2019. She listed her home in 2024. The buyer’s mortgage lender, using Fannie Mae guidelines, flagged the PPA as a fixture filing encumbrance. The PPA transfer required the buyer to qualify financially with the PPA company. It added 47 days to closing. Three similar deals in the same zip code fell through entirely that year.
Downside 3: The escalator can catch your utility rate. In markets where utility rates stay flat, like parts of the Tennessee Valley Authority (TVA) service area, a 2% annual PPA escalator can match or exceed your utility rate by year 12–15. You signed up to save money. By year 14, you are paying the same or more.
Downside 4: The company has legal access to your roof. Every PPA contract includes a roof access clause. The company can send technicians for inspections, cleaning, and repairs anytime with standard notice, usually 24–48 hours. If you want to re-roof or add a room addition, you need the company’s written consent to temporarily remove panels. That process takes weeks and costs $1,500–$4,000 in panel removal and reinstallation fees.
Before you sign, ask for the buyout schedule in writing. Typical buyout costs by contract year:
| Year of Buyout | Typical Buyout Cost |
| Year 3 | $18,000–$22,000 |
| Year 5 | $15,000–$19,000 |
| Year 8 | $12,000–$16,000 |
| Year 10 | $9,000–$13,000 |
| Year 15 | $4,000–$8,000 |
| Year 20 | $500–$2,000 |
Is a Solar PPA a Good Option for Businesses in 2026?
A commercial solar PPA is the right choice for a business in 2026 if it has an annual electricity spend above $60,000, cannot use the ITC directly, and has a Scope 2 emissions target to meet.
The math works differently for businesses.
Many small and mid-size businesses cannot fully absorb the 30% ITC in the year of installation. Their federal tax liability is too low. A PPA transfers that problem to the developer. The developer monetizes the ITC through a tax equity partnership. In return, the business gets a below-market electricity rate and zero capital outlay.
A manufacturing facility in Atlanta, paying Georgia Power $0.112/kWh on a C-10 commercial tariff with a $14,000 monthly bill, signs a 15-year commercial PPA at $0.075/kWh on a 500 kW rooftop system. Year-one savings: $44,400. Over 15 years at a 2% escalator versus Georgia Power’s 3.4% average annual rate increase since 2021, total savings reach $580,000–$640,000.
That is the business case. It is not about convenience. It is about the predictable energy cost for 15 years.
Three specific business situations where a PPA wins over ownership:
- Leased commercial property, you cannot put a capital asset on a building you do not own
- Nonprofit organizations, they cannot use the ITC at all, so ownership loses its biggest advantage
- C-PACE financing is not available in some states, blocking commercial property-assessed clean energy loans
Understanding how solar tax equity partnerships work explains exactly how the developer monetizes the ITC and how that affects the rate they offer you.
Is a PPA a Legal Agreement: What Contract Clauses Actually Protect You?
Yes, a solar PPA is a legally binding contract under state contract law, and four specific clauses determine whether it protects you or exposes you.
Most homeowners read the rate and the term length. They skip the four clauses that actually matter.
Clause 1: The Escalator Cap. Some PPAs cap the annual escalator, for example, “not to exceed 2.9% in any single year.” Others have no cap. An uncapped escalator in a high-inflation environment can accelerate past the projected rate. Get the exact percentage and any cap in writing before signing.
Clause 2: The Assignment Clause. This clause controls what happens when the company sells your contract to another company, and they do sell them. In 2023 and 2024, several large PPA portfolio companies sold residential contract bundles to private equity buyers. The assignment clause in most contracts allows this without your consent. The new owner is legally bound by your rate and term, but has no relationship with you and no servicing history.
Clause 3: The Roof Damage Liability Clause. Roof damage from improper installation or bracket failure is more common than the industry admits. Most PPA contracts limit the company’s liability to the cost of panel removal only. Structural roof repairs are often excluded. Check for an explicit warranty covering roof penetrations and any damage caused by installation.
Clause 4: The Performance Guarantee Clause. Some PPAs include a minimum production guarantee — the company promises the system will produce at least X kWh per year, or your rate is adjusted. Others have no guarantee. Without one, if the system underperforms due to shading or equipment failure, you pay the full PPA rate for less electricity than projected.
State AG offices in California, Arizona, and Texas have used the FTC Act Section 5 to take action against PPA companies that misrepresented escalator terms and omitted performance guarantee details from sales presentations.
For a full breakdown of how commercial solar PPA laws apply state by state, including enforcement actions and consumer rights, that resource covers the legal framework in detail.
Why Would You Buy Solar Instead of Signing a PPA?
You should buy solar instead of signing a PPA if you owe federal taxes, plan to stay in your home more than 8 years, or live in a state with SREC or production incentive programs that only pay system owners.
The ownership case is straightforward in states with strong incentives.
A homeowner in New Jersey buys a 9 kW system for $27,000. After the 30% federal ITC, net cost: $18,900. New Jersey’s SREC II program, administered under the Illinois Shines equivalent structure at the NJ BPU, pays system owners per solar renewable energy certificate generated. In 2026, SREC II prices in New Jersey range from $85–$95 per SREC. A 9 kW system generates roughly 10 SRECs per year. That is $850–$950 per year in SREC income on top of utility bill savings.
Compare that to a PPA on the same New Jersey home paying PSE&G $0.18/kWh, the current residential rate in 2026:
| Option | Upfront Cost | Year 1 Net Saving | Year 10 Total Saved | Year 20 Total | SREC Income |
| PPA | $0 | $720 | $8,100 | $18,400 | $0 |
| Purchase (after ITC) | $18,900 | $1,650 | $18,500 | $38,000 | $17,000+ |
The purchase pulls ahead of the PPA by year 7 in New Jersey. By year 20, ownership produces more than double the total financial return.
For more details on Tesla solar costs in New Jersey for 2026 and how purchased system pricing compares across installers in that market, the breakdown shows the real cost range before the ITC.
The only two situations where the PPA wins over buying:
- Your credit score is below 660, and no solar lender will approve you
- You plan to sell the home within 4 years, and the buyout cost is manageable
Everyone else is better off owning.
How Much Energy Does a Solar PPA Actually Save: The Real Numbers
A 9 kW solar PPA system offsets 80–100% of electricity usage for most homes and saves $50–$110 per month in year one, depending on your utility rate and local sun hours.
The savings number varies more than most articles admit. Here is why.
Your savings depend on four specific inputs:
- Your utility’s retail rate, PSE&G, at $0.18/kWh, saves you far more than TVA at $0.109/kWh
- Your system’s actual production, a shaded roof produces 20–40% less than a clear south-facing one
- The PPA rate and escalator, a $0.09 rate with 1% escalator vs. $0.12 with 3% escalator, are very different 20-year contracts
- Your utility’s rate trajectory, utilities raising rates 4%+ per year, makes PPAs look better every year
Using NREL PVWatts production data for three specific cities in 2026:
| City | Utility | Utility Rate | PPA Rate | System Output | Year 1 Saving |
| Houston, TX | CenterPoint Energy | $0.142/kWh | $0.090/kWh | 13,500 kWh | $702/yr |
| Phoenix, AZ | Salt River Project | $0.137/kWh | $0.095/kWh | 15,660 kWh | $656/yr |
| Newark, NJ | PSE&G | $0.180/kWh | $0.110/kWh | 10,800 kWh | $756/yr |
| Nashville, TN | NES / TVA | $0.109/kWh | $0.085/kWh | 11,700 kWh | $281/yr |
The Nashville number tells an important story. TVA’s base residential rate is the lowest of any major US utility at $0.109/kWh. A PPA at $0.085/kWh only saves $281 per year in year one, and the escalator closes that gap fast. By year 8 at a 2% escalator, the PPA rate hits $0.099/kWh. If TVA raises rates just 1.5% annually, the gap is nearly gone.
This is why PPAs make far less sense in TVA territory than in New Jersey or Arizona. Your utility rate is the single most important variable in the PPA decision.
The National Renewable Energy Laboratory’s solar production tool lets you enter your zip code and get an actual estimated kWh output for your roof. Use that number, not the salesperson’s estimate.
For investors tracking which utility markets are driving PPA volume in 2026, the best solar stocks to invest in include the largest residential PPA portfolio companies.
Is a Solar PPA Safe: The 5 Specific Risks You Need to Know
A solar PPA is financially safe if the company has been operating for more than 10 years, carries liability insurance above $2 million, and does not have active UCC-1 lien claims on the system it installs on your roof.
Most homeowners think the only risk is the rate. There are five distinct risks, and the rate is not the most dangerous one.
Risk 1: Portfolio Sale Without Notice. PPA companies sell contract bundles to investors. You signed with one company. Three years later, a private equity firm owns your contract. Your rate stays the same. Your service quality may not. Verify the contract’s assignment clause before signing, specifically, whether the new owner must honor all original warranty terms.
Risk 2: UCC-1 Financing Statement. When a PPA company finances the solar equipment through a lender, that lender files a UCC-1 financing statement against the panels. The lender now has a secured interest in the equipment on your roof. If the PPA company defaults on its loan, the lender can technically repossess the panels, even though they are on your home. Check your county recorder’s office for any UCC-1 filing tied to your address after installation.
Risk 3: Company Bankruptcy. Several residential solar companies entered bankruptcy between 2022 and 2025. When a PPA company files Chapter 11, your contract enters the bankruptcy estate. A bankruptcy trustee manages the portfolio. Service calls slow or stop. The resolution, sale to another company, or contract termination can take 12–18 months. During that time, your system may sit with no one responsible for repairs.
Risk 4: Roof Damage Liability Gaps. Most PPA contracts cap the company’s roof damage liability at the cost of panel removal only. If a mounting bracket causes a leak and the water damages your ceiling, insulation, and framing, the repair bill, often $4,000–$12,000, falls on your homeowner’s insurance. Some insurers exclude solar installation damage from standard policies. Confirm your homeowner’s policy covers third-party solar installation damage before signing.
Risk 5: Performance Shortfalls With No Guarantee. A system that produces 30% less than projected because of unexpected shading or panel degradation still bills you at the full PPA rate per kWh produced. You pay less in total, but you also save less. If there is no minimum production guarantee in the contract, you have no recourse for a system that underperforms due to equipment issues.
If you are evaluating a large commercial PPA and need the full risk framework for grid-level energy contracts, understanding TVA interconnection breach litigation shows exactly how energy contract failures play out at scale and what documentation you need from day one.
How Does a Virtual PPA Work for Corporate ESG Goals?
A virtual PPA lets a corporation buy electricity from an off-site solar project at a fixed price, earn renewable energy certificates, and report Scope 2 emissions reductions, without any panels on its property.
This is the tool Fortune 500 companies use for RE100 commitments. It is not a residential product. It is a corporate energy procurement instrument.
Here is the exact financial structure.
A corporation signs a 12-year virtual PPA with a solar developer for a 50 MW project in Texas. The strike price is $0.055/kWh. The project sells electricity into the ERCOT market at a floating market price.
- If the market price is $0.075/kWh, the developer pays the corporation the $0.020/kWh difference, a financial gain
- If the market price is $0.040/kWh, the corporation pays the developer the $0.015/kWh difference, a financial loss
- Either way, the corporation receives Renewable Energy Certificates (RECs), one per MWh produced
The REC is the ESG documentation. It satisfies GHG Protocol Scope 2 market-based accounting and qualifies for RE100 procurement reporting. It also counts toward the Science-Based Targets initiative (SBTi) renewable electricity commitments.
The financial risk is real. ERCOT market prices dropped to $0.028/kWh during several 2024 low-demand periods. Corporations holding virtual PPAs with $0.055/kWh strike prices paid the difference, a cost they had not budgeted. A virtual PPA is a financial derivative, not just a sustainability tool.
Three things every corporation must verify before signing a virtual PPA:
- Basis risk, the location difference between the project and your load, can cause settlement losses even when market prices are favorable
- Additionally, some ESG frameworks require the renewable energy to be “additional,” meaning it would not exist without your contract
- REC registry, RECs must be registered in WREGIS (West) or PJM-GATS (East) to be valid for most ESG reporting frameworks
For businesses that need legal review of virtual PPA contract terms, a solar project finance attorney experienced in ERCOT or PJM market structures is essential before a 10–15-year commitment.
How Does Solar Reduce Corporate Scope 2 Carbon Emissions?
An on-site solar PPA reduces a company’s Scope 2 market-based emissions to zero for the electricity generated by the system, documented through monthly production reports and annual REC retirement.
Scope 2 emissions are the greenhouse gas emissions from the electricity your company buys and uses. Under the GHG Protocol Corporate Standard, companies report Scope 2 in two ways:
- Location-based, uses the average emissions factor for your regional grid
- Market-based, uses the emissions factor of the specific electricity you contracted for
A solar PPA covers the market-based method. Every kWh your on-site system produces is zero-emission electricity. The PPA company provides monthly production reports and annual REC retirement documentation. Your sustainability team uses those records in your annual GHG inventory.
A 500 kW commercial solar PPA system in Atlanta producing 700,000 kWh per year eliminates approximately 350 metric tons of CO2 equivalent per year from your Scope 2 inventory, based on the Southeast US grid emissions factor of 0.499 kg CO2e/kWh from EPA’s e GRID 2024 data.
That reduction counts toward SEC climate disclosure rules, CDP reporting, and TCFD-aligned annual reports in 2026.
How Do You Negotiate a Better Solar PPA Rate?
You negotiate a better solar PPA rate by getting competing bids from at least three developers, specifying a cap on the escalator clause, and asking for a minimum production guarantee tied to NREL PVWatts data for your site.
Most homeowners and businesses accept the first rate they are offered. That is a mistake.
PPA rates in 2026 vary by 20–35% across developers for the same home in the same market. The spread exists because each company has different financing costs, different tax equity partner terms, and different overhead structures.
Four specific negotiation points that work:
- Escalator cap, ask for 1.5% maximum per year, not 2–3%; most developers will accept 1.75% to close the deal
- Production guarantee: Ask for a guarantee that the system produces at least 90% of the NREL PVWatts estimate for your roof; if it falls short, the PPA rate adjusts down proportionally
- Buyout schedule, ask for a fixed-dollar buyout table at years 5, 8, 10, 15, and 20 in the contract, not a formula that recalculates later
- Assignment notification, ask for a clause requiring a 60-day written notice before the company can sell your contract to a new owner
On the commercial side, understanding how solar tax equity partnerships work gives you direct insight into the developer’s cost structure, which tells you how low they can realistically go on the rate.
What Are the Rules for Off-Site Solar Procurement?
Off-site solar procurement through a virtual PPA or community solar subscription is governed by your state’s Public Utilities Commission tariff rules, FERC wholesale market regulations, and the REC registry rules for your grid region.
The rules vary significantly by state. Here is what matters in each structure:
Community Solar (Shared Solar): You subscribe to a portion of a solar farm’s output. Your utility credits your bill at the avoided cost rate or retail rate, depending on your state’s tariff. In 2026, states with retail-rate community solar credits include Illinois, New York, and Massachusetts. States using avoided cost, typically 30–40% lower, include Georgia and Florida. The credit structure determines whether community solar saves you meaningful money.
Virtual PPA (Corporate): Governed by FERC wholesale market rules in the grid region where the project operates. Basis risk, the pricing difference between the project’s delivery point and your load zone, is a real financial exposure that must be modeled before signing.
Wheeling Agreements: If you want to move solar electricity from a project in one part of the state to your facility in another, you need a wheeling agreement with the transmission owner. Wheeling rates in 2026 range from $0.005–$0.025/kWh, depending on the distance and the transmission owner’s tariff. In ERCOT (Texas), nodal pricing replaces traditional wheeling; basis risk and congestion charges substitute for wheeling fees.
PPA vs Solar Lease vs Solar Loan vs Cash Purchase: Full Comparison
A solar loan beats a PPA on total 20-year savings in almost every market. A cash purchase beats a loan. A PPA beats doing nothing if your utility rate is above $0.13/kWh. A lease is the least flexible option of all four.
Here is the complete comparison for a 9 kW system in a mid-tier US market at $0.15/kWh utility rate:
| Factor | Cash Purchase | Solar Loan | Solar PPA | Solar Lease |
| Upfront cost | $27,000 | $0–$2,000 | $0 | $0 |
| Federal ITC (30%) | You keep $8,100 | You keep $8,100 | The company keeps it | The company keeps it |
| Monthly payment | $0 | $140–$170 | $65–$95 | $85–$110 fixed |
| Rate changes | None | None | 1–3%/yr escalator | Fixed or 0–2% |
| 20-year total cost | $18,900 net | $22,000–$26,000 | $18,000–$24,000 | $20,000–$28,000 |
| 20-year total savings | $24,000–$28,000 | $18,000–$22,000 | $12,000–$16,000 | $10,000–$15,000 |
| Home equity built | $6,000–$8,000 | $5,000–$7,000 | $0 | $0 |
| Home sale impact | Easy, owned asset | Easy, owned asset | Requires transfer | Requires transfer |
| SREC eligibility | Yes | Yes | No | No |
| Best for | Long-term owners | Good credit, no cash | Poor credit or renters | Poor credit, fixed income |
The loan wins over the PPA for anyone with a credit score above 660. The monthly loan payment, typically $140–$170, is offset by the $120–$160 in monthly utility savings. Net monthly cost difference: $20–$50 per month. But in 8–10 years, the loan is paid off. The savings continue for another 15 years with no payment. That is the equity gap between owning and renting solar.
For investors who want to understand which financing model drives the most shareholder value in the solar sector, the best solar stocks to invest in for 2026 break down the PPA, lease, and loan portfolio exposure of the major publicly traded solar companies.
How Do You Track and Report Scope 2 Emissions From a Solar PPA?
You track Scope 2 emissions from a solar PPA using monthly production reports from the PPA company, annual REC retirement certificates from WREGIS or PJM-GATS, and your regional grid emissions factor from EPA eGRID.
The documentation chain for a valid Scope 2 market-based report:
- Step 1: The PPA company provides a monthly kWh production report for your system
- Step 2: RECs are registered and retired in your grid’s REC registry (WREGIS for West, PJM-GATS for East, M-RETS for Midwest)
- Step 3: Retired RECs generate a retirement certificate with a unique serial number
- Step 4: You apply a zero emissions factor to the kWh covered by retired RECs in your GHG inventory
- Step 5: Remaining grid electricity uses the EPA eGRID subregion emissions factor for location-based reporting
For a 500 kW commercial system producing 700,000 kWh in the Southeast (SERC subregion, 0.499 kg CO2e/kWh):
- Market-based Scope 2: 0 metric tons CO2e (covered by RECs)
- Location-based Scope 2: 349 metric tons CO2e (using SERC factor)
The difference, 349 metric tons, is your annual emissions reduction claim. That is what goes in your CDP questionnaire, your SEC climate disclosure, and your sustainability report.
The Honest Verdict: Who Should Sign a Solar PPA in 2026?
Solar power purchase agreements worth it in 2026 if your credit score is below 660, your utility rate tops $0.15/kWh, or you need zero upfront cost and plan to stay for fewer than 8 years. Everyone else is better off buying.
If you plan to stay 10 or more years and can qualify for a solar loan, ownership beats a PPA by $7,000–$12,000 over 20 years. You keep the 30% federal ITC, earn SREC income in eligible states, and build a real asset.
Pull your last 12 months of utility bills. Run the PPA rate against your utility rate using the exact escalator percentage offered, not the company’s projected savings chart. If the PPA still saves more than a loan payment costs each month, it might be your best option.
If not, understanding how SREC II programs work in your state will show you the ownership incentives that make buying the clear winner.
Frequently Asked Questions
Are solar power purchase agreements worth it for renters?
No, most landlords do not allow third-party companies to install equipment on their property. Community solar subscriptions are the better option for renters.
What is the average solar PPA rate in 2026?
PPA rates in 2026 range from $0.08–$0.14/kWh. Texas and Arizona markets average $0.085–$0.10/kWh. Northeast markets average $0.10–$0.14/kWh.
Can I cancel a solar PPA early?
Yes, but you pay a buyout fee. At year 3, typical buyout costs run $18,000–$22,000. At year 10, costs drop to $9,000–$13,000. Get the exact fixed-dollar schedule before you sign.
Does a solar PPA affect my home sale?
Yes. The buyer must qualify to assume the PPA, or you pay the buyout fee at closing. Lenders using Fannie Mae underwriting guidelines may flag the PPA as a fixture filing encumbrance and delay approval.
What happens if my PPA company goes bankrupt?
Your contract enters the bankruptcy estate. A trustee manages it. Service calls may stop for months. Resolution, sale to a new company, or contract termination, typically takes 12–18 months. Your panels still sit on your roof the entire time.
Is a solar PPA the same as a solar lease?
No. A lease charges a fixed monthly dollar amount regardless of system output. A PPA charges a per-kWh rate; your bill goes up in high-production months and down in low-production months.
What credit score do you need for a solar PPA?
Most PPA companies approve applicants with a credit score of 600 or above. Some accept 580 with proof of income. This is lower than most solar loan requirements, which typically start at 650–680.
How long is a typical solar PPA contract?
Most residential PPAs run 20–25 years. Commercial PPAs typically run 10–20 years. Some companies offer 15-year terms with a renewal option.
What happens at the end of a PPA contract?
You typically have three options: renew the PPA at a new rate, buy the system at fair market value (usually $1,000–$5,000 for a 20-year-old system), or have the company remove the panels at no cost to you.
Disclaimer: All savings estimates are based on publicly available utility rate data, NREL PVWatts production models, and 2026 IRS Section 48E tax credit rates. Actual savings vary by location, system size, roof orientation, shading, and contract terms. This article does not constitute financial, tax, or legal advice. Consult a licensed tax professional or attorney before signing any solar energy contract.

Morgan Lee | Solar Energy Advocate & Researcher
Morgan Lee is a Senior Renewable Energy Consultant and the founder of SolarInfoPath. With over a decade of experience in green technology and project finance, Morgan leverages data from the National Renewable Energy Laboratory (NREL) and the U.S. Department of Energy to provide homeowners with transparent, high-authority guidance.
Driven by a mission to protect consumers from misleading sales tactics, Morgan launched SolarInfoPath as a 100% independent platform. By translating complex utility policies into actionable advice, Morgan advocates for a smarter, more sustainable future where families can achieve true energy independence through honest information.