
The national average residential electricity rate hit 17.78 cents per kWh in early 2026, according to the U.S. Energy Information Administration. That figure is up from 15.92 cents just fourteen months earlier, representing an 11.6% jump in a little over a year. The EIA projects further increases through 2026, with New England already averaging 30.01 cents per kWh. For millions of American homeowners, that steady upward climb is exactly what is making rooftop solar worth a serious, honest look right now.
This guide covers how residential solar installation actually works in the U.S., from the first site visit to the moment your utility flips the switch and your panels start producing power. You will find real cost numbers, an honest look at where federal incentives stand today, what drives installation timelines, and how to think about whether solar makes financial sense for your home specifically. No sales pressure and no inflated promises, just the information you need to understand the process clearly before talking to anyone.
What the Full Solar Installation Process Actually Looks Like
Most homeowners picture solar installation as crews showing up to put panels on a roof. That part is real, but it is actually the fastest step in a much longer process. The complete solar installation journey typically takes 60 to 120 days from initial consultation to system activation. Permitting is the longest phase at 30 to 45 days. The physical installation itself takes just 1 to 3 days on your property.
Here is how the process breaks down in practice.
Stage 1: Site and Energy Assessment (1 to 3 weeks). A licensed solar professional reviews 12 months of your electricity bills, evaluates your roof’s age, pitch, material, and orientation, checks for shading from trees or neighboring structures, and determines whether your home is a genuinely good candidate. This is also when your electrical panel capacity gets assessed. Older homes with 100 amp panels frequently need an upgrade to 200 amps before a solar system can be installed. That upgrade adds $1,500 to $3,000 to project costs and is one of the most commonly overlooked line items in any solar installation budget.
Stage 2: System Design (1 to 2 weeks). Engineers match your home’s annual electricity consumption to an appropriately sized system. The National Renewable Energy Laboratory, a division of the U.S. Department of Energy, publishes the solar resource maps and PVWatts Calculator tool that professionals draw on to estimate annual production for any U.S. address. A practical sizing estimate: divide your annual kWh usage by 1,200 to approximate your ideal system size in kilowatts. A home consuming 10,800 kWh per year, right at the national average, typically needs a system around 9 kW.
Stage 3: Permitting (2 to 6 or more weeks). Solar permit and interconnection approval times range from 25 to 64 days depending on your state. The process involves four distinct phases: local authority permit review, pre installation utility interconnection evaluation, physical system inspection, and post installation grid connection authorization. Arizona processes permits in a median of 34 days. Florida also runs around 34 days. Massachusetts takes about 39 days. Some California counties have faced backlogs running 8 to 12 weeks. Systems over 10 kW require additional engineering review, adding 2 to 4 weeks to the process. Adding battery storage increases timelines by approximately 30%. Your installer handles all permit applications, but timelines are ultimately set by your local authority having jurisdiction, not by your installer’s schedule.
For a detailed breakdown of realistic timelines by state, including what causes delays and how to avoid them, see our complete guide on how long solar installation takes across different U.S. states.
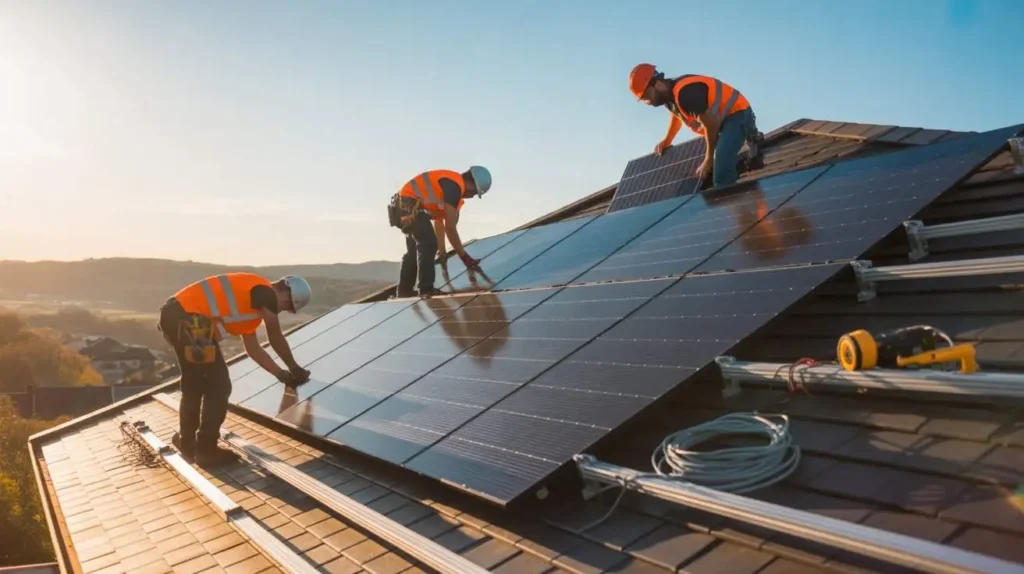
Stage 4: Physical Installation (1 to 3 days on site). Crews mount racking hardware to your roof, install panels, run conduit and wiring, connect the inverter, and tie into your main electrical panel. Roof type meaningfully affects labor time and cost. Asphalt shingle is the fastest and least expensive to work with. Clay tile or metal standing seam requires specialized hardware and typically adds 15 to 25% to labor costs. Most residential installs wrap up in a single day for standard configurations. Larger or more complex systems may run two to three days.
Stage 5: Utility Interconnection and Permission to Operate (2 to 12 weeks after installation). Most residential solar systems receive Permission to Operate within two to twelve weeks after installation completion, though timelines vary widely by utility provider and location. Duke Energy typically processes approvals in around 14 days. California’s major utilities including PG&E, SCE, and SDG&E average four to eight weeks. Operating your panels before Permission to Operate is issued is illegal in all 50 states and can result in fines, forced disconnection, and voided equipment warranties. Your installer files the interconnection application. The utility then sends someone to verify safety compliance and installs a bidirectional meter for net metering purposes.
What Solar Installation Costs in 2026: Real Numbers
Systems average about $2.58 per watt before incentives based on EnergySage Marketplace data, with a typical 12 kW installation coming in around $30,505 before any incentives are applied. Most homeowners spend between $12,600 and $33,376 to install a complete residential solar system in 2026, with the national average sitting at $19,873 before incentives.
Here is how those figures translate into real system costs at different home sizes:
| System Size | Installed Cost Before Incentives | Typical Household Profile |
| 5 kW | $12,900 to $16,250 | Small home, low usage, mild climate |
| 7 kW | $18,060 to $22,750 | Medium home, moderate AC usage |
| 9 kW | $23,220 to $29,250 | Average to large home, higher usage |
| 10 kW | $25,800 to $32,500 | Large home, EV charging, high loads |
| 12 kW | Approximately $30,505 | High consumption home, all electric |
Regional variation is significant. Southwest and Texas installations run $2.07 to $2.85 per watt. Mountain West and some Northeast markets reach $2.66 to $3.80 per watt. Arizona consistently posts some of the lowest installed costs nationally at around $2.07 per watt. Tennessee, by contrast, runs among the highest at approximately $3.65 per watt, driven by lower installer competition and more complex permitting environments.
Solar panels themselves represent just 12% of the total installed cost of a system. Equipment overall including panels, inverter, and racking accounts for roughly 40 to 50% of total project cost. Labor runs 25 to 35%. Permitting, interconnection fees, and soft costs such as overhead, sales, and system design make up the remaining 20 to 30%. Permit fees alone range from under $200 in some rural jurisdictions to over $1,500 in dense metro areas.
Battery storage, if added, runs an additional $10,000 to $15,000 depending on capacity and configuration, and is priced separately from the base solar system. If your roof has less than 10 to 15 years of remaining life, removing and reinstalling panels to re-roof later costs $3,000 to $5,000 as a standalone job. That is a cost that catches many homeowners off guard years down the line.
For a full breakdown of what solar actually costs after state incentives, rebates, and program credits are applied in your specific state, see our detailed guide on solar panel costs after incentives for U.S. homeowners.
The Federal Tax Credit in 2026: What Every Homeowner Must Know
This is the section that changes the financial calculation most significantly for anyone making solar decisions in 2026.
The federal 30% residential solar Investment Tax Credit expired on December 31, 2025. The credit, known as Section 25D of the tax code, was eliminated for customer owned systems as part of legislation signed in mid 2025. Third party owned residential solar projects such as leases and power purchase agreements continue to qualify for tax incentives if construction began before July 2026, because the commercial entity rather than the homeowner claims those credits.
Here is what that means depending on your specific situation.
If you installed and owned a solar system before December 31, 2025, you can still claim the 30% credit when filing your 2025 federal tax return using IRS Form 5695. That credit is yours and is not being clawed back.
If you are purchasing and owning a solar system in 2026, there is no federal residential tax credit available under current law. On a $25,000 system, that means you are effectively paying $7,500 more than a 2025 buyer paid for an equivalent system after the ITC.
If you go solar through a lease or power purchase agreement in 2026, the leasing company that owns the system may still capture commercial tax incentives and pass some of that value to you through lower monthly rates. You do not claim any federal credit directly in this arrangement.
This shift makes state level incentives more financially important now than they have been in two decades. Property tax exemptions, sales tax exemptions, solar renewable energy credit programs, and net metering policies that once played a supporting role to the federal ITC now carry the primary weight of the incentive case for most homeowners in 2026.
Who Actually Qualifies for Solar Incentives in 2026
Not every homeowner qualifies for every solar incentive available in their state, and the eligibility rules vary widely by state, utility, income level, and system ownership structure. Some programs are open to all homeowners regardless of income. Others are specifically designed for low to moderate income households and offer more generous terms. Certain SREC and net metering programs have enrollment caps that close once a utility reaches a specific percentage of solar penetration on the grid.
Key eligibility factors that affect what you can actually access include your utility’s specific interconnection tariff, whether your state’s net metering program is currently open to new applicants, whether you own or lease the system, your annual federal tax liability, and your location within the state. Rural electric cooperative members and municipal utility customers often face entirely different program structures than customers of investor owned utilities in the same state.
For a detailed breakdown of who qualifies for solar incentives across different U.S. states and program types, see our complete eligibility guide on who qualifies for solar incentives in the USA.
Why Solar Still Makes Financial Sense in 2026 and Where It Does Not
The expiration of the federal ITC does not make solar uneconomical across the board. What it does is widen the gap between strong solar states and weak ones, and make electricity rates and state policy more important than ever before.
The EIA forecasts that compared to 2022 prices, nominal residential electricity rates will rise 18% by 2026, and prices have consistently outpaced general inflation since 2022. That structural upward trend is the core reason solar makes financial sense over a 20 to 25 year horizon. You are not simply buying panels. You are locking in a portion of your electricity cost today against rates that have risen an average of 3.5% annually for the past decade.
The financial case in 2026 rests on three pillars more than ever before.
Your state’s electricity rate. At 18.02 cents per kWh nationally in 2026, every kWh your panels produce is worth 18.02 cents in avoided grid purchases. States with high rates amplify returns dramatically. California’s average rate sits at 31.91 cents per kWh as of February 2026. New Jersey experienced a 16.1% year over year increase, the largest state level jump in the country. Illinois rose 15.8% year over year. In these markets, solar’s value per kilowatt hour is significantly above the national average even without any federal incentive.
Your state’s net metering policy. This single policy variable determines how much credit you receive when your panels produce more than your home uses at a given moment. States with full retail net metering including New Jersey and Florida credit exported solar at the full rate you pay for electricity. States that have scaled back net metering require more careful system sizing to maximize self consumption. Arizona’s APS credits exports at approximately 7.6 cents per kWh. Nevada credits 75% of retail, roughly 11.25 cents per kWh. California’s NEM 3.0 reduced export credits to around 2 to 5 cents per kWh for most daytime hours for the major investor-owned utilities.
State tax exemptions and incentive programs. Many states maintain property tax and sales tax exemptions for solar entirely independent of federal policy. New Jersey’s SuSI SREC II program pays $85 per megawatt hour generated for 15 years, a revenue stream completely separate from any federal incentives. Arizona’s 25% state income tax credit capped at $1,000, its full sales tax exemption, and its property tax exemption all remain intact in 2026.
Understanding Solar Payback Periods in 2026
Most homeowners will save between $37,000 and $154,000 over 25 years with solar according to EnergySage Marketplace data, with total savings depending heavily on electricity rates, system size, and state incentive structure.
Payback period is the most practically useful number for comparing solar across different states and situations. It represents the number of years until your cumulative electricity savings equal your net system cost. Before the ITC expired, the national average payback ran approximately 7.3 to 7.5 years for cash purchasers. Without the 30% federal credit in 2026, payback periods for cash buyers extend meaningfully, though exactly how much depends on your state’s electricity rate and incentive package.
Here are rough 2026 payback estimates by market for cash purchases without the federal ITC:
| State or Market | Approximate Payback in 2026 | Key Driver |
| New Jersey | 8 to 10 years | 23 cents per kWh rate plus SuSI SREC program |
| California | 9 to 11 years | 31.91 cents per kWh rate, NEM 3.0 reduces export value |
| Massachusetts | 8 to 10 years | Approximately 26.72 cents per kWh plus SMART program |
| Arizona via APS | 11 to 13 years | 14.9 cents per kWh plus state credit, reduced export rate |
| Texas via Austin Energy | 11 to 13 years | 14.9 cents per kWh plus VOS 9.91 cents per kWh buyback |
| Nevada | 12 to 14 years | 15 cents per kWh plus 75% net metering |
| Tennessee | 14 to 17 years | 12 cents per kWh, TVA 2 cents per kWh export, no state credit |
Financing changes the calculation significantly. Solar specific loans typically include dealer fees averaging 15 to 20% added into the loan principal, which meaningfully increases your total cost over a 20 year loan term compared to paying cash. Understanding total cost of ownership rather than just the monthly payment matters enormously when comparing financing options.
For a complete state by state breakdown of payback periods, how they are calculated, and what assumptions matter most for your specific situation, see our full guide on solar payback periods for U.S. homeowners.
Key Factors That Determine Whether Solar Is Right for Your Home
National averages are a useful starting point but not a final answer. Your individual circumstances drive whether solar makes strong financial sense, marginal sense, or no sense at this particular time.
Roof suitability. A south facing roof with a pitch between 15 and 40 degrees and minimal shading produces the most energy per panel. East or west facing roofs work but typically produce 10 to 20% less than an optimal south facing array. Shading from even a single tree limb during peak production hours reduces output meaningfully on standard string inverter systems. Microinverters and power optimizers partially address shading at added cost.
Roof age and condition. Solar panels carry 25 year performance warranties. If your roof needs replacement in 8 years, you are looking at $3,000 to $5,000 in removal and reinstallation costs mid system life. Addressing roof condition before installation is straightforward financial planning.
Your electricity consumption level. Homes using 10,000 kWh or more annually see the best returns because there is more grid consumption to offset. High usage loads such as central air conditioning, electric water heating, EV charging, and electric ranges all strengthen the financial case considerably. Homes consuming under 6,000 kWh annually may find that smaller systems adequately cover their needs, but the economics are tighter.
How long you plan to stay in your home. Solar produces its strongest financial returns over 10 to 25 years. Homeowners who may move within four to five years should weigh payback periods carefully against their expected tenure. That said, owned solar systems do add measurable resale value. Recent research shows solar installations boost property values by approximately 6.9% on average in the U.S.
Your specific utility and net metering tariff. Two identical homes with identical sun exposure and identical panels can have dramatically different 25 year financial outcomes based solely on their utility’s export credit rate. This is the most underestimated variable in most solar decisions.
How U.S. Electricity Rates Vary by Region and Why It Matters for Solar
Not all electricity is priced equally, and that variation shapes the solar opportunity more than almost any other factor.
Hawaii pays 39.89 cents per kWh, more than twice the national average, because the state imports petroleum for most power generation and has no access to mainland grid infrastructure. At that rate, even a modest solar system produces enormous annual savings. Louisiana sits at 12.44 cents per kWh, about 31% below the national average. That low rate lengthens solar payback periods considerably and makes state incentive quality especially important for Louisiana homeowners.
The residential sector stands out nationally with prices projected to average close to 18 cents per kWh in 2026, while commercial customers pay approximately 13.5 cents per kWh and industrial customers average 8.54 cents per kWh. The gap between what residential customers pay versus commercial and industrial customers is one reason rooftop solar makes more compelling financial sense for homeowners than it often does for small businesses operating under commercial rate schedules.
The states with the highest rates in early 2026 including California at 31.91 cents, Massachusetts at approximately 26.72 cents, Connecticut, Rhode Island, and New York in the 25 to 30 cent range are exactly the states where solar’s financial returns are strongest even without the federal ITC. The states with the lowest rates including Louisiana at 12.44 cents, North Dakota at 11.93 cents, and parts of the rural Southeast face the most challenging solar economics in 2026 under current conditions.
Net Metering Explained: Why This Policy Changes Everything
Net metering is the billing arrangement that determines how much credit you receive when your solar panels produce more electricity than your home uses at a given moment. The excess power flows to the grid, and your utility credits your account. How much credit you receive and how long it lasts varies enormously by state and by utility.
Full retail net metering means every kWh you export is credited at the same rate you pay for grid electricity. If you pay 18 cents per kWh, you receive 18 cents per kWh in credit. States including New Jersey and Florida currently mandate this structure for investor owned utilities, making it the most favorable arrangement for solar homeowners.
Reduced rate net metering or net billing means exported solar is credited at a rate below retail. Arizona’s APS credits new customers at approximately 7.6 cents per kWh, roughly half the retail rate. Nevada credits 75% of retail, approximately 11.25 cents per kWh. California’s NEM 3.0 reduced export credits to around 2 to 5 cents per kWh for most daytime hours under the major investor owned utilities.
Minimal export credit structures like TVA’s 2 cents per kWh in Tennessee or SRP’s approximately 2.8 cents per kWh in Arizona’s East Valley change the economics fundamentally. In these markets, a solar system that significantly overproduces relative to your actual daytime consumption is effectively losing money at the margin. System sizing for self consumption rather than maximum production is the correct strategy in these utility territories.
Understanding which category your utility falls into before choosing a system size is not an optional step. It directly determines whether your system’s long term economics are strong, fair, or disappointing.
The Honest Limitations: When Solar Does Not Make Sense Right Now
The most trustworthy solar content acknowledges where the product falls short just as clearly as where it excels.
Unsuitable roof conditions are more common than installation sales materials typically acknowledge. Heavily shaded roofs, roofs with less than 10 years of remaining life, and complex multi plane designs with limited unobstructed south facing space can make installation expensive or inefficient enough that the numbers simply do not justify it at this time.
Short time horizon in your home. If you are likely to move within four to five years, the financial case for owning a system weakens considerably. A lease arrangement or no solar at all may make more practical sense depending on your circumstances.
Low electricity rates. Homes in states where rates consistently sit below 12 cents per kWh face longer payback periods in 2026, particularly without the federal ITC. The financial case for solar in low rate states relies much more heavily on strong state incentive programs to compensate.
Financing costs. A cash purchase and a financed purchase of the same system produce very different 25 year financial outcomes. Solar specific loans frequently embed 15 to 20% dealer fees into the loan principal, meaning your effective system cost is meaningfully higher than the quoted installation price. Understanding total cost of ownership rather than focusing only on the monthly payment is essential.
TVA and minimal export credit territories. Tennessee and other areas where the local utility compensates exported solar at approximately 2 cents per kWh present genuinely challenging economics for solar systems installed without battery storage. In those markets, battery storage is not a nice addition. It is financially necessary to make the investment work well over the long term.
Explore Solar by State
Every state has different electricity rates, utility rules, net metering policies, peak sun hours by city, and available incentive programs. The state specific articles on SolarInfoPath are built around exact figures including real utility names, real export credit rates, real sun hour data by city, and honest payback estimates rather than national averages that may not reflect your actual situation.
Use the state navigation below to find your state and get the full, current picture before making any decisions.
SolarInfoPath is an independent solar education resource written by Morgan Lee, a U.S. homeowner and independent energy researcher. All figures are sourced from the U.S. Energy Information Administration, National Renewable Energy Laboratory, Lawrence Berkeley National Laboratory, EnergySage Marketplace data, and publicly available utility tariff filings. No solar products are sold on this site. No paid placements, affiliate links, or installer relationships exist. Savings and payback estimates are educational illustrations and vary by household, utility, location, and system configuration. This content is not financial or tax advice.