A typical residential solar panel cost of any system in the U.S. is between $16,000 and $28,000 before incentives in 2026, or roughly $2.50 to $3.50 per watt. After the 30% federal tax credit, most homeowners pay $11,000 to $19,500 out of pocket, with the final number shaped heavily by system size, roof complexity, and local labor rates.
Solar panel cost is rarely a single number, no matter how often a sales flyer makes it sound that way. Your final price depends on how much electricity you use, what your roof looks like, where you live, and how you choose to pay for the system. This guide breaks down each piece so you can compare a quote against real numbers instead of guessing whether you’re being overcharged.
In most states, the average homeowner pays a monthly electric bill of $120 to $180. That usage level usually points to a 6kW to 10kW system. Knowing your own kWh number before you talk to an installer changes the conversation entirely; you stop reacting to a sales pitch and start evaluating a proposal.
Average Solar Panel Cost in the USA
The national average for solar panel cost lands between $2.50 and $3.50 per watt installed, before any tax credit is applied. A standard 6kW to 10kW residential system typically totals $15,000 to $35,000, with most homeowners landing closer to the middle of that range.
This isn’t a flat number, though. Two homes with identical electricity usage can end up with installation costs that differ by several thousand dollars, purely based on roof shape and local permitting fees.
Cost by System Size (kW)
| System Size | Average Cost (Before Tax Credit) | Cost After 30% Federal Tax Credit |
| 4 kW | $11,000 – $14,000 | $7,700 – $9,800 |
| 6 kW | $16,500 – $21,000 | $11,550 – $14,700 |
| 8 kW | $22,000 – $28,000 | $15,400 – $19,600 |
| 10 kW | $27,500 – $35,000 | $19,250 – $24,500 |
| 12 kW | $33,000 – $42,000 | $23,100 – $29,400 |
Larger systems typically lower your cost per watt, since fixed costs like permitting and the initial site visit are spread across more panels. A 10kW system rarely costs exactly twice as much as a 5kW system; it’s usually closer to 1.7x.
National Average Price Per Watt
The national average price per watt in 2026 sits between $2.50 and $3.20, depending on equipment quality and installer overhead. Premium monocrystalline panels with microinverters can push that figure toward $3.50 or higher.
Here’s where the numbers shift: price per watt drops as system size increases, but only up to a point. Past roughly 12kW, economies of scale flatten out, and adding more panels costs nearly as much per watt as the system before it.
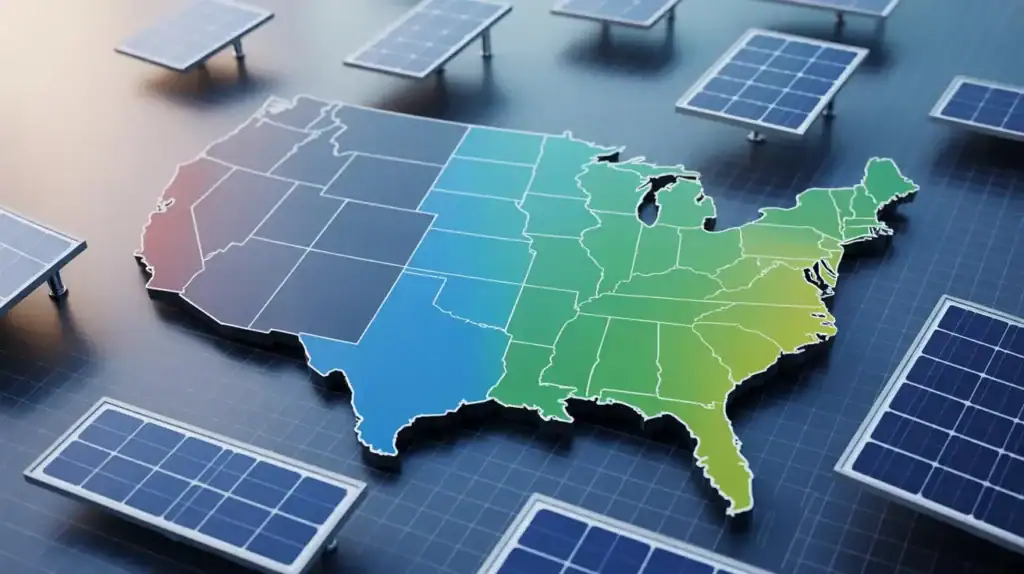
Solar Panel Cost by State
Solar panel cost varies more by state than most buyers expect, sometimes by $1 or more per watt. Labor rates, permitting fees, and local installer competition all factor into the final number, separate from sunlight availability.
Cheapest States for Solar
States like Arizona, Florida, and Texas tend to offer some of the lowest installed costs per watt, often in the $2.20 to $2.80 range. High installer competition and streamlined permitting in fast-growing solar markets help keep soft costs down.
This is the part most people overlook: a low price per watt doesn’t always mean a cheap total system. States with high sun exposure sometimes need smaller systems to offset the same usage, which lowers the total bill even further.
Most Expensive States for Solar
States like California, New York, and Massachusetts often see installed costs closer to $3.00 to $3.80 per watt, driven by higher labor costs, stricter permitting requirements, and union labor rules in some metro areas. Read more about how solar panel permit requirements can extend timelines and add administrative costs in these states.
What Determines the Cost of Solar Panels?
Five factors drive most of the variation in solar panel cost: system size, roof condition, equipment quality, location, and installer pricing. Understanding each one helps you spot whether a quote is reasonable or inflated.
System Size and Energy Usage
Your system size should match your annual kWh usage, not an arbitrary number an installer suggests. A household using 11,000 kWh per year typically needs an 8kW to 9kW system in a moderately sunny region.
Oversizing a system to “maximize savings” is one of the more common upsells homeowners encounter. It rarely pays back proportionally to the added cost.
Roof Type and Complexity
A simple, south-facing roof with one or two planes is the cheapest to install on. Roofs with multiple angles, dormers, skylights, or steep pitches can add 10% to 20% to labor costs due to extra mounting hardware and installation time.
If your roof is older or has visible wear, it’s worth checking whether solar panels cause roof damage before installation begins, since mounting issues are easier to address upfront than after panels are in place.
Equipment Quality and Panel Type
Monocrystalline panels cost more upfront but offer higher efficiency and a longer expected lifespan, often backed by 25-year performance warranties. Polycrystalline panels are less expensive but require more roof space to produce the same output.
Inverter choice matters too. Microinverters or power optimizers add $1,000 to $2,500 to a system but improve performance on roofs with partial shading. It’s worth understanding what a solar warranty actually covers before assuming all equipment guarantees are equal.
Location and Labor Costs
Local labor rates, permitting fees, and interconnection requirements vary by city and utility, not just by state. Two homes 40 miles apart can see different installation costs purely due to differing municipal permitting fees.
Installer Selection
Installer overhead, sales commission structure, and company size all affect price. Larger national installers often charge more per watt than smaller regional companies, though pricing alone shouldn’t be the only factor in choosing one.
Solar Panel Cost Breakdown: Where Your Money Goes
A solar quote isn’t just panels. Roughly 35% to 40% of total cost goes toward equipment, while the remaining 60% to 65% covers labor, permitting, sales overhead, and company profit margin.
Hard Costs (Equipment)
Hard costs include panels, inverters, racking, wiring, and the electrical components that make up the physical system. For a typical 8kW system, hard costs usually total $9,000 to $11,000.
Soft Costs (Labor, Permitting, Overhead)
Soft costs, installation labor, permitting fees, interconnection applications, marketing, and company profit typically make up the largest single share of your total bill. This is the category most homeowners don’t expect, and it’s also the category with the most price variation between installers.
Cost Per Watt vs. Cost Per Square Foot Explained
Cost per watt measures price relative to system capacity, while cost per square foot measures price relative to physical roof space used. Cost per watt is the more useful comparison metric since it accounts for panel efficiency differences.
A high-efficiency panel system might use less roof space but cost more per watt. A lower-efficiency system might cover more roof area for a similar total price. Comparing quotes using cost per watt removes that confusion.
Hidden and Additional Solar Costs
Beyond the base system price, several add-on costs catch homeowners off guard after signing. These typically aren’t included in an initial quote unless specifically requested.
- Electrical panel upgrades, often required if your home’s panel is below 200 amps
- Roof repair or replacement, needed before installation if your roof is near the end of its lifespan
- Maintenance and cleaning, usually minimal but relevant in dusty or pollen-heavy climates
- Battery storage add-ons, which significantly increase total project cost
Electrical Panel Upgrades
Homes with an electrical panel rated below 200 amps frequently need an upgrade before solar installation, adding $1,500 to $4,000 to the project. Older homes, particularly those built before 1990, are the most likely to need this.
Roof Repair or Replacement
If your roof has less than 10 years of remaining life, most installers recommend replacing it before mounting panels. Doing so after installation typically costs 2 to 3 times more due to panel removal and reinstallation labor.
Maintenance and Cleaning
Solar panels require minimal maintenance, typically $150 to $300 annually for occasional cleaning in most climates. Areas with heavy pollen, dust, or wildfire smoke may need more frequent cleaning to maintain peak output.
Battery Storage Add-On Costs
Adding battery storage typically adds $10,000 to $20,000 to total project cost, depending on capacity. Homeowners considering storage should review a detailed battery storage guide before committing, since battery sizing mistakes are common and expensive to correct.
How to Pay for Solar Panels
Three payment paths exist for solar: cash purchase, solar loan, or lease/PPA. Each changes your total lifetime cost significantly, even when the upfront sticker price looks similar.
Cash Purchase
Paying cash results in the lowest lifetime cost and the fastest path to full ownership, since there’s no interest or dealer fee added to the price. It also qualifies you for the full federal tax credit directly.
Solar Loans
Solar loans spread payment over 10 to 25 years but add interest and sometimes a “dealer fee” of 10% to 30% built quietly into the loan principal. This fee is rarely disclosed clearly upfront, and it’s one of the more common contract surprises homeowners report after signing.
Leases and Power Purchase Agreements (PPAs)
Leases and PPAs require no upfront payment, but you don’t own the system and typically don’t qualify for the tax credit. Total payments over 20 to 25 years often exceed what a cash purchase would have cost, sometimes substantially.
Solar Incentives That Lower Your Cost
Incentives can meaningfully reduce your net cost, though availability depends heavily on your state and utility.
State Tax Credits
Some states offer additional credits on top of the federal incentive, though many states have phased these out as solar adoption increased. Always verify current eligibility directly with your state’s energy office before assuming a program still exists.
Local Utility Rebates
Certain utilities offer one-time rebates for new solar customers, typically ranging from $500 to $3,000. These programs often have limited annual funding and can close without much notice.
Net Metering Programs
Net metering credits you for excess electricity sent back to the grid, directly affecting your payback timeline. Some states have reduced net metering compensation in recent years, which makes verifying your specific utility’s current rate essential before finalizing a system size.
Is Solar Worth the Cost? Payback Period & Long-Term Savings
For many homeowners, the solar payback period falls between 6 and 12 years, depending on system cost, local electricity rates, and available incentives.
If your monthly bill is under $100, the math often doesn’t favor solar nearly as strongly, since the system size needed wouldn’t offset enough usage to justify the upfront cost within a reasonable timeframe.
This is where decision pressure tends to be highest. A homeowner in a high-electricity-rate region with a $200+ monthly bill often sees a stronger return than someone with a $90 bill in a low-rate state, even with identical sun exposure.
One honest limitation worth stating clearly: solar isn’t automatically a good financial decision just because it’s available in your area. Roof age, current electricity rate, and how long you plan to stay in the home all matter more than most sales conversations suggest.
Homes with solar can also sell faster in some markets, which is worth factoring into a long-term cost analysis. You can check how solar affects time to sell a home for more on that pattern.
How to Get an Accurate Solar Cost Estimate
An accurate estimate starts with your actual kWh usage from the last 12 months, not a rough guess. Request an itemized quote that separates equipment cost, labor, permitting fees, and any dealer or loan fees, rather than one bundled number.
Comparing at least two or three quotes side by side, using cost per watt as the baseline metric, makes it far easier to spot an inflated soft-cost markup. If a quote seems unusually low, it’s worth asking specifically what equipment tier and warranty length is included, since brand name comparisons, including premium options like a Tesla solar panel cost review, can clarify where the price difference is actually coming from.
Frequently Asked Questions About Solar Panel Cost
How much does one solar panel cost?
A single residential solar panel typically costs $200 to $350 before installation, depending on wattage and efficiency tier. Labor and balance-of-system costs make up the bulk of total solar panel cost, not the panels themselves.
What is the average solar panel cost for a home in 2026?
Average solar panel cost for home installations ranges from $16,000 to $28,000 before incentives, or $11,000 to $19,500 after the 30% federal tax credit. Most homeowners land in the 6kW to 10kW range based on typical usage.
What’s a good solar panels price per watt?
A competitive solar panels price in 2026 generally falls between $2.50 and $3.00 per watt for a standard installation. Anything notably above $3.50 per watt is worth questioning before signing.
Is solar panel cost USA-wide consistent, or does it vary by state?
Solar panel costs USA-wide vary by $1 or more per watt between states, driven by labor rates, permitting fees, and installer competition rather than sunlight alone. Arizona, Florida, and Texas tend to run cheaper, while California, New York, and Massachusetts run higher.
What determines solar panel cost beyond the panels themselves?
Soft costs, labor, permitting, interconnection fees, and overhead typically account for 60% to 65% of total solar panel cost, more than the equipment itself. Roof complexity, system size, and installer selection all shift the final number too.
Are there hidden costs added to the average solar panel cost?
Yes. Electrical panel upgrades ($1,500–$4,000), roof repair, and battery storage add-ons ($10,000–$20,000) are common costs left out of an initial quote. Always ask for an itemized breakdown before comparing solar panel prices between installers.
How does financing affect solar panels cost for home buyers?
A cash purchase results in the lowest lifetime cost of solar panels, while loans add interest and sometimes a hidden 10–30% dealer fee. Leases and PPAs require no upfront payment but typically cost more over 20–25 years and don’t qualify for the tax credit.
Do solar panels increase home value, and is the cost worth it?
Solar panels can increase home value in many markets, particularly when the system is owned outright rather than leased. Given a typical 6- to 12-year payback period, the average solar panel cost is often worth it for homes with monthly bills above $120.
This article by SolarInfoPath (2026 research framework) is part of a comprehensive solar knowledge architecture covering all major high-value sectors including legal disputes (installation negligence, contracts, liability, fraud, lawsuits, liens, HOA and permitting disputes), financial structures (loans, PPA/lease agreements, DSCR financing, tax equity, investment and project finance), tax law (ITC, Section 48/25D, MACRS depreciation, bonus credits, IRS audits, recapture rules, domestic content and IRA/OBBBA compliance), insurance and risk (property damage, hail/wind/fire claims, bad faith insurance disputes, warranty coverage), policy and regulation (net metering, FERC interconnection, state utility rules, incentive programs and regulatory changes), commercial and utility-scale development (EPC contracts, construction delays, performance bonds, receivership, bankruptcy, asset sale and restructuring), real estate impacts (home value, solar leases, liens, title issues, HOA restrictions, easements), and emerging market structures such as battery storage, community solar, agrivoltaics, SRECs, yieldcos, and institutional investment funds. All content is based on publicly available regulatory, financial, and legal sources and is intended strictly for educational and informational purposes, not legal, tax, or financial advice. Readers should always verify current laws, utility policies, tax regulations, and contract terms with qualified licensed professionals before making decisions, as solar regulations, incentives, and financial structures frequently change across jurisdictions and time.

Solar Legal Analyst· Policy Researcher· Investigative Finance Writer Lead Analyst & Founder of SolarInfoPath
Morgan Lee is a solar legal analyst, policy researcher, and investigative finance writer with 12+ years of experience in U.S. renewable energy law, IRS tax credit compliance, and solar litigation. He is the founder of SolarInfoPath, a research-driven platform focused on primary-source analysis of solar contracts, tax law, regulatory policy, and industry disputes affecting homeowners and commercial developers.
His work is grounded in original legal and regulatory sources, including IRS notices, FERC and CPUC rulings, state court filings, PACER records, and UCC lien databases. He specializes in solar contract disputes, injury and workers’ compensation claims, PACE financing issues, tax equity structures, ITC recapture rules, MACRS depreciation, and federal and state solar policy frameworks.
Morgan’s analysis spans solar litigation, finance structures, and regulatory developments such as the IRA and OBBBA, interconnection reform, domestic content rules, and battery storage incentives. He also covers EPC contracts, PPAs, project financing, and utility-scale solar investment structures.