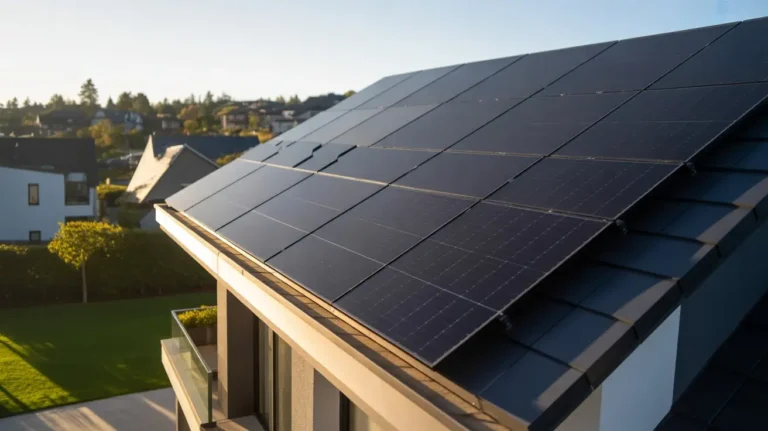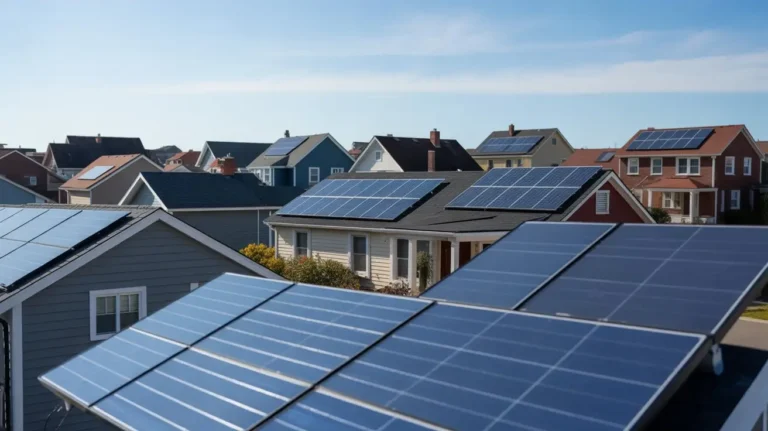
Solar Panels Pros and Cons 2026: The Honest Guide for U.S. Homeowners
Electricity bills in the United States have gone up in 44 out of 50 states over the past three years. That single fact is driving more homeowners than ever to seriously look at rooftop solar. But looking into it and actually understanding the solar panels pros and cons 2026 are two very different things. Most of what you will find online either oversells the benefits or skips the limitations entirely. Neither helps you make a smart decision for your specific home and budget.
What I have learned from going through this process myself, and from watching neighbors in different states navigate it, is that solar is not universally great or universally risky. It depends on your electricity rate, your state’s current policies, your roof, and your financial situation. In 2026, a few things have also changed that shift the calculation compared to even two years ago, and those changes deserve a clear, honest look.
What Solar Actually Costs in 2026: Before and After Incentives
The upfront cost of a residential solar system in the United States currently ranges from $18,000 to $30,000 before any incentives, depending on system size, your location, and local labor rates. A standard 7kW to 8kW system, which is appropriate for a home using 900 to 1,200 kilowatt hours per month, typically runs around $21,000 to $25,000 before the federal tax credit.
The federal Investment Tax Credit is still at 30 percent in 2026. On a $22,000 system, that brings your effective out-of-pocket cost to roughly $15,400. Several states stack additional incentives on top of that. Massachusetts offers a 15 percent state income tax credit on top of the federal credit. New York’s NY Sun program adds cash incentives that further reduce upfront cost. Florida exempts solar equipment from state sales tax and shields the added home value from property tax reassessment. Arizona offers a 25 percent state income tax credit capped at $1,000.
Not every state is this generous. Texas, Georgia, and Kansas offer little or nothing beyond the federal credit. In those states, the $15,400 net cost after the federal credit is essentially what you pay.
One thing people often miss is that the federal tax credit is not a refund check. It reduces the taxes you owe. If your annual federal tax liability is $4,000 and your credit is $6,600, you will not receive the extra $2,600 in cash. You carry it forward to the following year. Understanding who qualifies for solar incentives in the USA before you sign any contract is genuinely important, because eligibility and how you claim the credit are two things installers often gloss over.
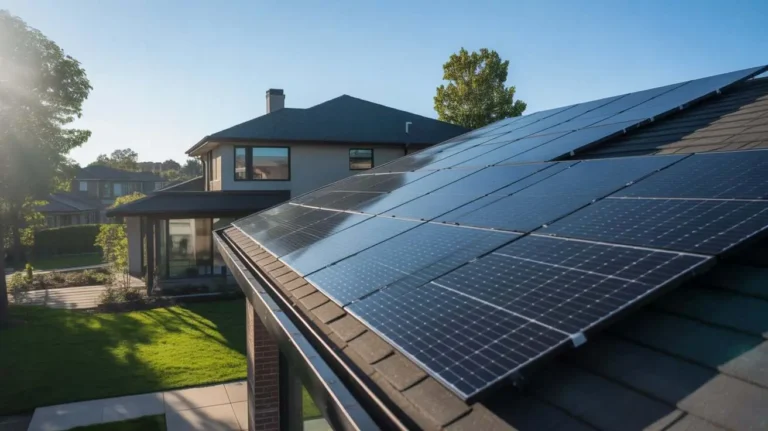
The Pros: Where Solar Delivers Real Financial Value
The strongest financial case for solar in 2026 exists in states where electricity is expensive. Your electricity rate, not your sun hours, is the single biggest driver of monthly savings. Here is what that looks like with real numbers:
California homeowners pay an average of 27 cents per kilowatt hour. A properly sized system for a Sacramento or San Diego home typically saves $150 to $200 per month. Annual savings often land between $1,800 and $2,400. The payback period after incentives runs 7 to 10 years for most homes.
Massachusetts averages 24 cents per kilowatt hour. Despite having fewer peak sun hours than southern states, Boston and Springfield area homeowners routinely save $120 to $155 per month. The strong electricity rate does most of the work.
New York sits at around 21 cents per kilowatt hour. Monthly savings for homeowners in Albany, Buffalo, and New York City typically run $110 to $145, with the NY Sun program making the upfront cost more manageable.
Florida has a lower rate at around 12 cents per kilowatt hour, but the state’s excellent year-round sunshine compensates. Tampa and Orlando homeowners typically save $100 to $130 per month. The consistency of Florida production is one of the strongest selling points in the Southeast.
Arizona gets more peak sun hours than almost anywhere else in the country. Phoenix homeowners average 6.5 peak sun hours per day, which pushes monthly savings to $110 to $150 even at a modest 13-cent rate. Tucson performs similarly.
Texas monthly savings typically run $80 to $105. The state gets solid sun, but lower electricity rates and the absence of a statewide net metering policy keep savings on the lower end.
Beyond the monthly bill reduction, solar also protects you from future rate increases. Every time your utility raises its rate, your panels are offsetting usage at that higher price without you paying more. That rate protection compounds over a 25 year system lifespan in a way that a fixed mortgage or car payment does not. Looking at the full picture of solar costs and incentives by state shows you how these numbers look for your specific situation before you commit to anything.
City by City Comparison: What Homeowners Are Actually Saving
| City | Avg Sun Hours Per Day | Est. Monthly Savings | Key Solar Notes |
| Phoenix, AZ | 6.5 hrs | $110 to $150 | Best sun in the country; summer production is exceptional |
| Los Angeles, CA | 5.7 hrs | $160 to $210 | High rates drive strong savings despite premium install costs |
| Tampa, FL | 5.5 hrs | $100 to $130 | Reliable year-round output; net metering policy is solid statewide |
| Austin, TX | 5.2 hrs | $85 to $105 | Good sun but no statewide net metering; savings vary by utility |
| Boston, MA | 4.2 hrs | $120 to $155 | Less sun than southern cities but top electricity rates offset it |
| Albany, NY | 4.5 hrs | $110 to $145 | NY Sun program helps; winter output drops meaningfully |
| Wichita, KS | 4.8 hrs | $60 to $90 | Decent sun but low rates stretch payback past 12 years |
The Cons: Honest Problems Every Homeowner Should Know
Net metering policy risk is the biggest issue in 2026. California changed its net metering rules in 2023 under NEM 3.0, reducing the export credit rate for new installations by roughly 75 percent compared to what the previous policy offered. Homeowners who installed before the change kept their better credit rate. Those who installed after saw a fundamentally different financial return. Michigan, Nevada, and several other states are evaluating similar changes. If your monthly savings estimate is built on full retail net metering and your state adjusts that policy after you install, your return drops without anything going wrong on your roof.
The payback period is longer than most people expect in lower-rate states. In Kansas, where electricity averages around 11 cents per kilowatt hour, monthly savings on a standard system run $60 to $90. That pushes payback to 12 to 15 years even after the federal tax credit. Solar still delivers a positive return over a 25-year system life, but the early years require patience. Anyone who tells a Kansas homeowner they will break even in 7 years is not being straight with them.
Roof condition is often overlooked until it is too late. If your roof is more than 15 years old or needs replacement within the next five years, installing solar panels before replacing it is a mistake. Removing and reinstalling a solar system costs $1,500 to $4,000 on top of whatever the roof replacement costs. I have seen homeowners skip this step, replace the roof two years later, and pay twice for work they could have scheduled together.
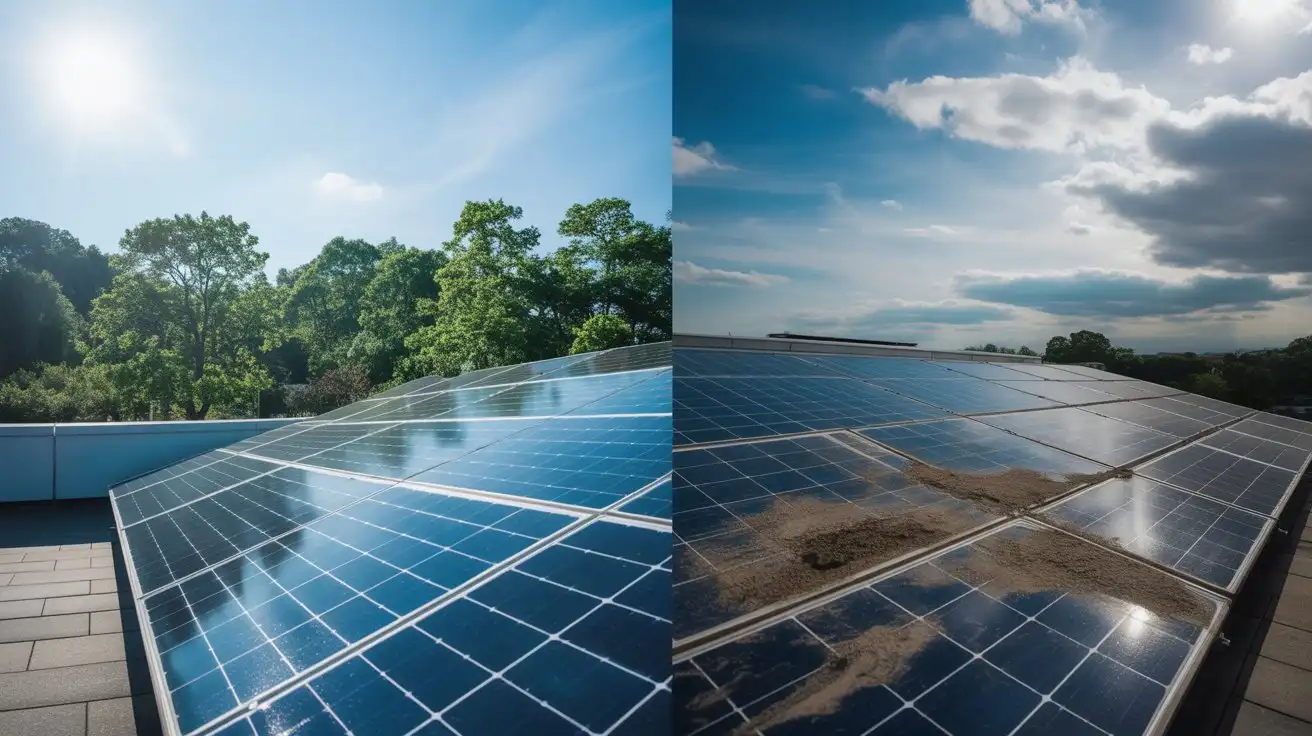
Shading hurts more than most people realize. A single large tree or chimney casting shade over even a portion of your roof can cut system output by 20 to 30 percent. If your roof has shading from neighbors, trees, or nearby structures, the savings projections need to be adjusted before you trust any estimate a salesperson gives you.
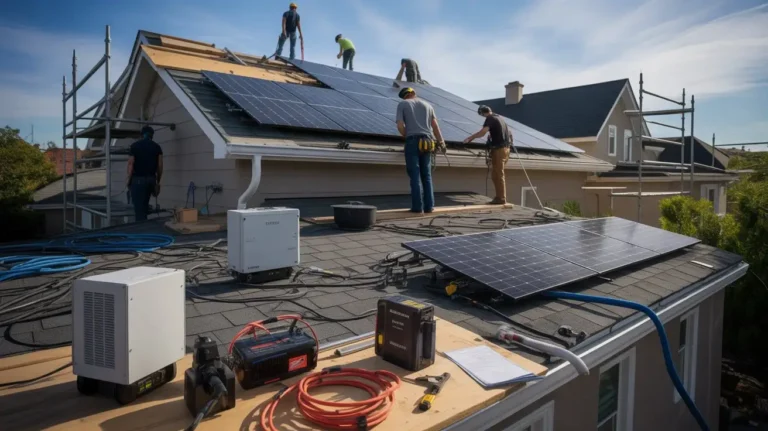
The installation timeline is not instant. Permitting, utility interconnection approval, and installation scheduling mean most homeowners wait 6 to 14 weeks from signing to producing power. Understanding how long home solar installation typically takes sets the right expectation, so the wait does not feel like something has gone wrong.
A Real Homeowner Story With Actual Numbers

Marcus owns a three-bedroom home in Phoenix, Arizona. His electricity bill averaged $210 per month before solar, which is common for a home running central air conditioning from May through October. He installed a 7.5kW system in early 2024.
Total installed cost: $22,500. After the 30 percent federal tax credit, he owed $15,750. Arizona’s state income tax credit added another $1,000 reduction, bringing his real out-of-pocket cost to $14,750.
His system produced 11,400 kilowatt hours in its first full year. At APS electricity rates, that came to approximately $1,540 in annual bill reduction. His average monthly savings ran about $128. His estimated payback period is just under 10 years. After payback, 15 or more years of production runs at essentially no additional cost to him.
What Marcus did not expect was how dramatically the seasons affected his monthly numbers. June, July, and August together accounted for nearly 40 percent of his full-year savings. December and January were noticeably slower. His December bill still showed a reduction, but nothing close to summer. Understanding that seasonal pattern before you install avoids disappointment when the first winter bill arrives.
What Is Different in 2026 Specifically
The federal tax credit situation is the most time-sensitive factor right now. The 30 percent credit is currently written into law through 2032, but there is real legislative uncertainty about whether it survives at that level, gets reduced, or gets extended unchanged. Reading about what is happening with the solar tax credit through 2026 and beyond is genuinely useful if you are deciding whether to install this year or wait. The credit has been extended before, but treating it as permanent without checking the current law is not a sound financial approach.
Battery storage is also changing the math in specific states. In California and New York, where time-of-use pricing charges more for electricity used in the evening, pairing panels with a home battery lets you store midday production and use it during expensive evening hours instead of exporting it at a reduced NEM 3.0 credit rate. For California homeowners specifically, adding storage meaningfully improves the monthly savings compared to panels alone under the new rules.
Installer competition in most markets has kept equipment costs more stable than many predicted. The U.S. Department of Energy notes that residential solar costs have dropped more than 60 percent over the past decade, and 2025 set a new record for residential installations across the country. More competition typically benefits buyers through better pricing and more options.
Pros and Cons at a Glance by State
| State | Monthly Savings | Strongest Pro | Biggest Con |
| California | $150 to $200 | Highest electricity rate drives strong returns | NEM 3.0 reduced export credits for new installs |
| Massachusetts | $120 to $155 | State credit stacks on federal for a lower net cost | Winter production drops in December and January |
| New York | $110 to $145 | The NY Sun program provides meaningful cash incentives | Shorter winter days reduce annual output |
| Florida | $100 to $130 | Consistent year-round sun hours | Lower rate limits the monthly savings ceiling |
| Arizona | $110 to $150 | Most sun hours of any state | Limited state incentives beyond the federal credit |
| Texas | $80 to $105 | Large market keeps install prices competitive | No statewide net metering; utility rules vary widely |
| Kansas | $60 to $90 | Lower average install cost in some markets | Low rate pushes payback past 12 years for most homes |
Understanding how solar panels actually generate electricity and reduce your bill gives you the foundation to read these numbers clearly and evaluate whether any quote you receive is realistic for your home.
Final Thoughts
The solar panels pros and cons 2026 conversation is more nuanced than it was even two years ago. Policy changes, net metering shifts, and the open question around the federal tax credit make 2026 a year where timing and state selection matter more than they did in 2022 or 2023. For homeowners in California, Massachusetts, and New York, the financial case is still genuinely strong. For Texas and Florida homeowners, it works but requires realistic expectations. In Kansas and similar low-rate markets, solar is a long-term investment that can still deliver positive returns over a full system lifespan.
At SolarInfoPath, our goal is to give you the honest version of this information so you can make your own decision with real data, not sales pressure. If your electricity rate is above 15 cents per kilowatt hour, your roof is in good condition, and you can use the federal tax credit fully in year one, solar is likely worth serious consideration in 2026. If one or more of those factors do not apply, the decision needs more careful math before you commit.
FAQs
What are the main advantages and disadvantages of solar panels?
The biggest advantage is lower electricity bills over time.
The main drawback is the upfront cost and policy variation by state.
Are solar panels good and bad points different by state?
Yes, they can vary widely. You may notice faster savings in California than in Kansas due to electricity rates.
Is solar energy good or bad for homes with low electric bills?
In my experience, homes with low monthly bills may see slower payback. It depends on your usage and local incentives.
Do solar panels increase home value in the USA?
In certain markets like Massachusetts or California, they often make homes more attractive. Results can vary by neighborhood.
What affects solar panel benefits and drawbacks USA homeowners see?
Utility rates, sun exposure, net metering credits, and roof shading all play a role. This is where things get tricky because rules differ by state.
Are solar panels worth it in 2026?
I think they are worth it for many homeowners, especially in high-rate states. It depends on your budget, roof condition, and long-term plans.

Morgan Lee is a homeowner and solar energy researcher based in the United States. After installing a rooftop solar system in 2022 and spending months comparing quotes, incentives, and installer reviews, Morgan realized how confusing and overwhelming the process felt for most American families. That experience led to the creation of SolarInfoPath, a no-pressure, educational platform designed to help U.S. homeowners understand solar energy clearly and confidently. Morgan focuses on practical, research-backed information covering solar costs, installation timelines, federal tax credits, and long-term savings. All content on this site is written from a homeowner’s perspective with the goal of making solar energy simple and accessible for everyday Americans.