
Solar value isn’t the same everywhere. Electricity rates, installation costs, sunlight, incentives, and utility rules all shift the math from one state to the next. This guide walks through the factors that actually determine the answer to are solar panels worth it in my state, using transparent calculations instead of a single blanket answer.
Are Solar Panels Worth It in My State? Understanding the Main Factors
Four variables decide most of the outcome: installation cost, electricity rates, solar production, and incentives.
What Determines Whether Solar Panels Are Worth It?
Installation costs, electricity rates, solar production, and incentives all affect financial value together, not in isolation. Electricity bill savings and total investment returns are related but different numbers. The same system can produce very different financial outcomes depending on which state it sits in.
How Electricity Rates Affect Solar Savings
Utility electricity prices directly influence how much a unit of solar electricity is worth. Rate structures and time-of-use pricing can change that value further. High electricity rates alone do not guarantee a short payback period, since cost and production still matter just as much.
How Solar Production and Sunlight Affect Financial Value
Peak sun hours, system orientation, shading, and local weather all shape how much electricity a system actually produces. Daylight hours and solar energy production are not the same thing. Production estimates feed directly into projected savings, so a bad estimate skews everything downstream. Much of the underlying production modeling used across the industry traces back to data from the National Renewable Energy Laboratory (NREL, U.S. Department of Energy).
Is Solar Worth It in My State? Comparing Costs and Savings
Is solar worth it in my state usually comes down to comparing what a system costs against what it actually saves, state by state.
How Much Do Solar Panels Cost in Different States?
State-level installation cost differences come from system size, equipment, labor, permitting, and general installation complexity. National averages don’t always reflect what a specific homeowner will actually be quoted. Anyone estimating a project’s timeline should also factor in solar panel permit requirements, since permitting can add real time before installation even begins.
Is Solar Worth It in My State Once Savings Are Counted?
Answering is solar worth it in my state once savings are counted means separating gross electricity bill savings from net financial savings. Annual electricity savings depend on system production and utility rates, and an illustrative example with clearly stated assumptions is more useful than a single number pulled from an ad.
Is Solar Worth It in My State? Why Savings Differ From State to State
Is solar worth it in my state is ultimately a state-specific question, not a nationwide one. Electricity prices, sunlight, incentives, and utility compensation policies all vary, and a state with lower installation costs can still end up with a longer payback period. Local utility rules can matter just as much as statewide averages. Newer solar markets illustrate this well, and a guide to solar panels in Washington shows how a state with modest sun still works out the math differently than a sunnier one.
Solar Payback Period by State: How Long Does Solar Take to Pay for Itself?
Solar payback period by state comparisons only mean something when the underlying assumptions are consistent.
What Is the Solar Payback Period?
Simple solar payback compares net upfront cost against annual savings. It’s a different measure than ROI or internal rate of return, both of which account for the time value of money in ways simple payback doesn’t. A general explanation of solar payback periods in the USA walks through this calculation in more depth.
How to Calculate a Solar Payback Period by State
The formula is straightforward: simple payback period equals net system cost divided by annual net savings. Estimating net cost and annual savings correctly means including relevant incentives and any ongoing expenses that apply. This is the core formula behind any solar payback period by state estimate.
What Can Make a Solar Payback Period by State Longer or Shorter?
Electricity rates and utility compensation, system installation costs, solar production and household electricity use, financing costs and applicable incentives, and changes in electricity prices or utility rules can all push a payback period in either direction, which is why these factors together explain why solar payback period by state figures vary so much.
Which States Have the Fastest Solar Payback Periods in 2026?
Which states have the fastest solar payback periods in 2026 depends on holding every other variable constant while comparing.
Which States Have the Fastest Solar Payback Periods in 2026? Comparing Across States
A fair comparison needs the same system size, the same cost basis, and the same household electricity usage across every state examined. Identifying the data year and source for each state’s figures matters too, since a 2022 estimate compared against a 2026 one isn’t really a comparison at all. This is the standard process for determining which states have the fastest solar payback periods in 2026.
Which States Have the Fastest Solar Payback Periods in 2026? The Role of Electricity Rates
Higher electricity rates can increase the value of self-consumed solar power, but net-metering and export compensation rules change that calculation meaningfully. High rates alone don’t establish the shortest payback period, which is a common assumption worth checking rather than accepting.
How to Build a State-by-State Solar Payback Table
| Comparison Factor | What to Report |
| State | State name |
| Typical installed cost | Verified cost estimate |
| Electricity rate | Applicable residential rate |
| Solar production | Estimated annual output |
| Incentives | Verified eligible incentives |
| Annual net savings | Calculation and assumptions |
| Estimated payback | Result using consistent methodology |
No state should be labeled as having the fastest payback unless the underlying data actually supports that conclusion. States with strong solar economics, like the Nevada market covered in this analysis of why solar panels are worth it in Nevada, still need this same verified, apples-to-apples comparison rather than a general reputation for being “good for solar.” None of this changes the fact that which states have the fastest solar payback periods in 2026 depends entirely on verified, current data.
Is It Worth Switching to Solar Power in a State With High Electricity Rates?
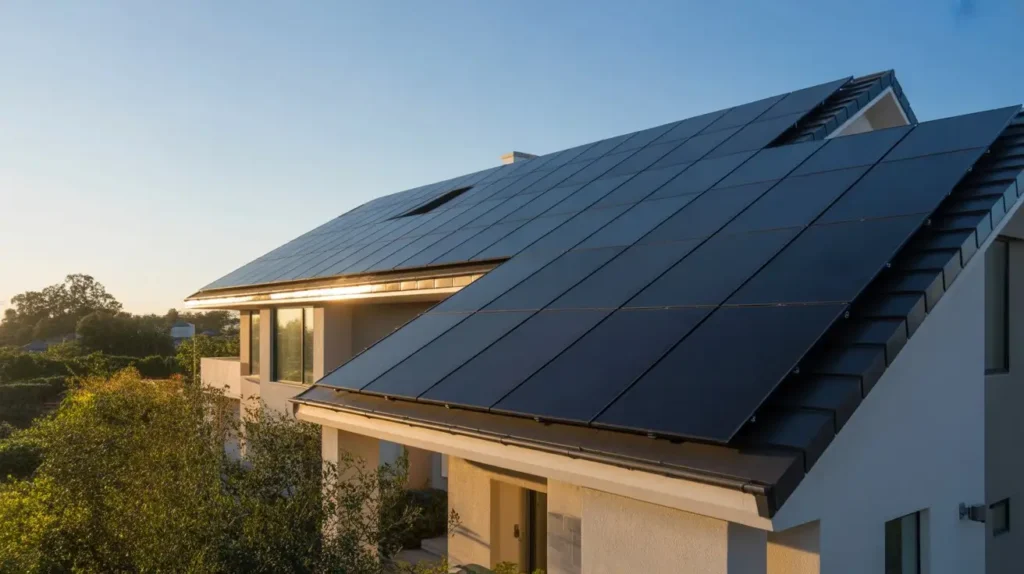
Is it worth switching to solar power in a state with high electricity rates is one of the most common framings homeowners search for, and the honest answer is: usually, but not automatically.
Is It Worth Switching to Solar Power in a State With High Electricity Rates? Why Rates Increase Savings
Avoided utility purchases become more valuable as electricity rates climb, and rate structures influence exactly how that savings calculation works. Retail electricity rates and export-credit rates are not the same number and shouldn’t be treated as interchangeable.
Is It Worth Switching to Solar Power in a State With High Electricity Rates? Why Faster Payback Isn’t Guaranteed
Installation costs may be higher in that state, solar production may be lower, utility export compensation may be limited, and financing costs or system performance can all offset what looked like an obvious win on paper. This is exactly why is it worth switching to solar power in a state with high electricity rates doesn’t have a single universal answer.
How to Evaluate Solar Value in a High-Rate State
Estimating annual solar production, calculating avoided electricity purchases, accounting for exported electricity and applicable compensation, and comparing net savings against total system cost covers the core steps. Comparing regional cases side by side helps too, and a look at why solar panels are worth it in Georgia is a useful example of how a specific state’s numbers actually play out. Answering is it worth switching to solar power in a state with high electricity rates always comes back to verified, state-specific numbers.
Why States Are Making It Harder to Save Money With Solar Panels
Why states are making it harder to save money with solar panels usually traces back to three policy areas: net metering, fixed charges, and incentive changes.
Why States Are Making It Harder to Save Money With Solar Panels: Net-Metering Changes
Changes in utility compensation can reduce the value of exported electricity, and net metering is different from other billing arrangements a utility might use instead. Policy changes can affect new and existing systems differently, so grandfathering matters as much as the headline policy change itself. This is one of the clearest reasons why states are making it harder to save money with solar panels right now.
Why States Are Making It Harder to Save Money With Solar Panels Through Fixed Charges
Fixed charges apply to a portion of an electricity bill that solar can’t offset no matter how much a system produces. Time-of-use rates can also change the value of electricity generated at different times of day. Both of these shift projected savings in ways a simple average rate doesn’t capture.
State Incentive Changes and Solar Economics
Incentive availability and eligibility rules can change system costs significantly, and program deadlines matter as much as the incentive amount itself. It’s worth distinguishing a documented, specific policy change from a broad generalization about “solar getting worse” in a state, since the two aren’t always the same thing. Homeowners weighing a project against a shrinking federal benefit should also look at what’s changing as the solar tax credit ends in 2026 before assuming last year’s numbers still apply. Together, these shifts explain why states are making it harder to save money with solar panels than they were just a few years ago.
Are Solar Panels Worth It in Louisiana? Costs, Savings, and Payback
Are solar panels worth it in Louisiana specifically depends on the same variables covered above, applied to Louisiana’s actual rates and sun exposure.
Are Solar Panels Worth It in Louisiana? What Affects Solar Value There
Sunlight, electricity rates, and installation costs all shape solar economics in Louisiana specifically. Local utility billing rules matter too, and roof orientation, shading, and weather all affect production estimates for any given property. That’s the core of answering are solar panels worth it in Louisiana for a particular property.
Are Solar Panels Worth It in Louisiana? Costs and Potential Electricity Savings
Estimating system cost and annual generation requires verified local electricity-rate and solar-production data rather than a national average. Any illustrative savings calculation should be clearly labeled as such rather than presented as a guarantee.
Louisiana Solar Payback and Incentive Considerations
Calculating a payback period with current, verified data, identifying applicable state and utility program rules, and accounting for financing and utility compensation together determine what a Louisiana homeowner can realistically expect. Ultimately, are solar panels worth it in Louisiana comes down to running these numbers with real, current data.
Are Solar Panels Worth It? Comparing Solar Ownership and Financing
How a system is paid for changes the payback math just as much as the state it’s installed in.
Buying Solar Panels With Cash
A cash purchase means full upfront cost and immediate ownership, along with ongoing maintenance responsibility. Cash purchase costs feed directly into a simple payback calculation without any financing charges added on top. Homeowners scaling well past a typical home system sometimes compare their numbers against this utility-scale solar guide covering cost and land rules for context on how the economics shift at a larger scale.
Financing Solar Panels With a Loan
Loan payments, interest, and repayment terms all factor in here. System ownership and the cost of borrowing are separate concerns, and a cash-purchase payback calculation looks meaningfully different from a financed cash-flow calculation. Larger residential or small commercial projects sometimes reference figures closer to a commercial solar panel installation cost breakdown once financing terms get more complex.
Solar Leases and Power Purchase Agreements
Third-party ownership and different payment structures apply under a lease or PPA. Contract duration, escalators, and transfer conditions all matter, and lease or PPA economics should be compared using total contractual costs rather than the first year’s payment. Whether solar power purchase agreements are actually worth it depends heavily on those same contract details.
Are Solar Panels Worth It in My State? Comparing Solar With Utility Electricity
Are solar panels worth it in my state ultimately gets compared against one thing: what the utility would have charged instead.
Solar Electricity Savings vs. Utility Bills
Solar generation offsets electricity purchases, but self-consumed electricity and exported electricity aren’t valued the same way. Fixed utility charges often remain on the bill even after installation, which is easy to overlook when estimating savings.
How Net Metering Affects Solar Payback
Net metering affects how exported electricity gets valued, and full retail credits are just one of several possible export-compensation arrangements a utility might use. Utility-specific rules matter more here than general assumptions about how net metering “usually” works.
How Electricity Price Increases Affect Long-Term Solar Savings
Future rate changes can affect projected savings significantly, and transparent assumptions work better than treating future price increases as guaranteed. Changing rates shift payback estimates in ways that are easy to model but hard to predict with certainty.
Are Solar Panels Worth It in My State? Evaluating Solar Incentives and Tax Benefits
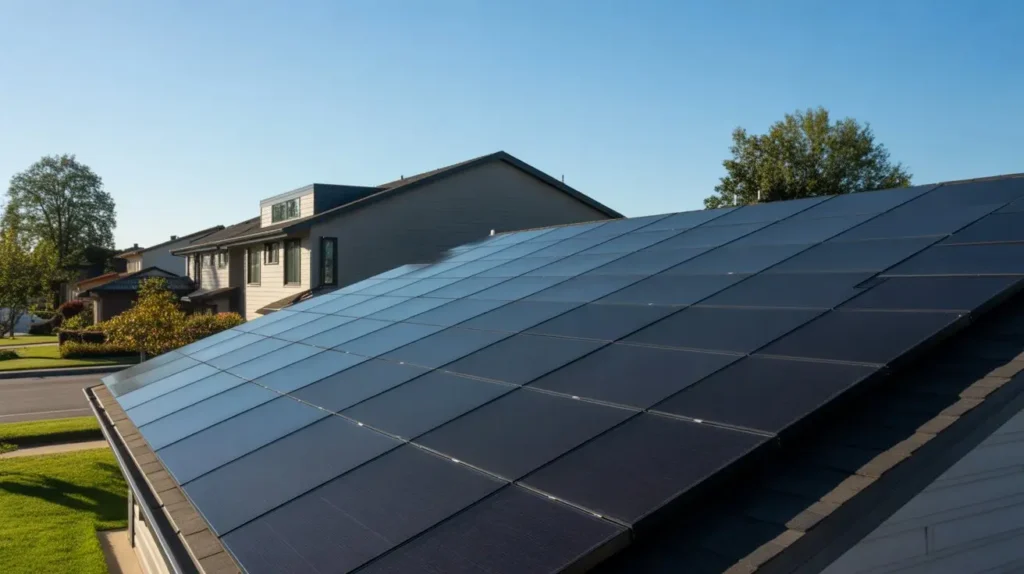
How State Solar Incentives Affect Upfront Costs
Rebates, performance-based incentives, and other eligible benefits are not interchangeable, and eligibility, along with program availability, needs direct verification rather than assumption. Incentives affect the net cost used in a payback calculation, not the gross system price.
How Federal Solar Tax Provisions Affect the Calculation
Tax credits and direct rebates work differently, and eligibility depends on current law and individual circumstances rather than a blanket assumption that every homeowner qualifies. Larger or commercial-style projects sometimes use different structures entirely, and an explanation of how solar tax equity partnerships work covers one of those alternative approaches.
How to Avoid Double-Counting Solar Incentives and Savings
Upfront incentives and annual electricity savings need to stay separate line items. Credit payments and utility bill credits are also distinct from each other. Keeping financial assumptions consistent throughout the calculation avoids the most common estimating mistake homeowners make.
How Much Can You Save With Solar Panels? A State-Specific Calculation
How much can you save with solar panels breaks down into three concrete steps once the guesswork is removed.
Step 1: Estimate Annual Solar Electricity Production
System size and expected annual output come first. Local solar resource, roof orientation, and shading all factor into that production estimate.
Step 2: Calculate Electricity Bill Savings
Estimating self-consumed solar electricity, applying the relevant utility rate, and accounting for export compensation and fixed charges where applicable together produce a realistic savings figure. Getting a sense of baseline system cost first, using a resource like this average solar panel cost guide, makes the rest of this calculation easier to sanity-check.
Step 3: Calculate Net System Cost and Payback
Starting with the installed system cost, subtracting only applicable and verified incentives, and dividing net cost by estimated annual net savings gives a payback estimate. That result should always be presented as an estimate, not a guaranteed outcome. Homeowners curious about the broader solar investment landscape sometimes also look at a best solar stock to invest in out of general interest, though that’s a separate question from financing a home system.
Common Financial Risks and Limitations
Every solar purchase carries some financial risk, and knowing where it comes from matters as much as knowing the potential savings.
Changes in Utility Rates and Solar Compensation
Rate changes may affect future savings in either direction, and understanding utility policies and contract terms ahead of time reduces the chance of an unpleasant surprise later. Homeowners who feel a sales pitch glossed over these risks might want to consult a solar scam consumer-protection attorney before signing anything.
Roof Condition, Maintenance, and Equipment Replacement
Roof repairs and equipment maintenance can add to overall project costs well after installation. Evaluating roof condition before installation avoids paying to remove and reinstall panels later. Equipment warranties are also not the same thing as guaranteed financial performance. Anyone dealing with installation-related roof issues might find a solar panel property damage attorney useful for that specific situation.
Solar Financing Costs and Contract Obligations
Interest, fees, and contract terms all affect total cost, and comparing total payments rather than monthly payments alone avoids one of the more common financing mistakes. Projected savings should always account for these realistic costs rather than an idealized best case. Homeowners looking to exit a solar lease early, particularly in California, may want to review a solar lease buyout attorney before assuming a straightforward exit.
Are Solar Panels Worth It? Frequently Asked Questions
Are solar panels worth it in every state?
Not identically. Solar economics vary by electricity rates, system costs, sunlight, incentives, and utility policies, so the same system can perform differently depending on where it’s installed.
How long does it take for solar panels to pay for themselves?
It depends on simple payback, which is net cost divided by annual savings. Electricity rates, system cost, production, and incentives all influence that number.
Can solar panels save money in a state with low electricity rates?
Sometimes, though lower rates reduce avoided electricity costs. Installation cost and production still matter just as much as the rate itself.
Do solar panels still save money without net metering?
Often yes, though the math changes. Self-consumption and whatever export compensation is available both affect the final savings figure.
How much can you save with solar panels in a year?
It depends on system size, local electricity rates, and production, so a state- or household-specific estimate is more useful than a national average.
Which factors matter most when comparing solar payback across states?
Installation costs, electricity rates, solar production, incentives, and utility compensation together determine payback, and no single factor tells the whole story on its own.
This article by SolarInfoPath (2026 research framework) is part of a comprehensive solar knowledge architecture covering all major high-value sectors including legal disputes (installation negligence, contracts, liability, fraud, lawsuits, liens, HOA and permitting disputes), financial structures (loans, PPA/lease agreements, DSCR financing, tax equity, investment and project finance), tax law (ITC, Section 48/25D, MACRS depreciation, bonus credits, IRS audits, recapture rules, domestic content and IRA/OBBBA compliance), insurance and risk (property damage, hail/wind/fire claims, bad faith insurance disputes, warranty coverage), policy and regulation (net metering, FERC interconnection, state utility rules, incentive programs and regulatory changes), commercial and utility-scale development (EPC contracts, construction delays, performance bonds, receivership, bankruptcy, asset sale and restructuring), real estate impacts (home value, solar leases, liens, title issues, HOA restrictions, easements), and emerging market structures such as battery storage, community solar, agrivoltaics, SRECs, yieldcos, and institutional investment funds. All content is based on publicly available regulatory, financial, and legal sources and is intended strictly for educational and informational purposes, not legal, tax, or financial advice. Readers should always verify current laws, utility policies, tax regulations, and contract terms with qualified licensed professionals before making decisions, as solar regulations, incentives, and financial structures frequently change across jurisdictions and time.

Solar Legal Analyst· Policy Researcher· Investigative Finance Writer Lead Analyst & Founder of SolarInfoPath
Morgan Lee is a solar legal analyst, policy researcher, and investigative finance writer with 12+ years of experience in U.S. renewable energy law, IRS tax credit compliance, and solar litigation. He is the founder of SolarInfoPath, a research-driven platform focused on primary-source analysis of solar contracts, tax law, regulatory policy, and industry disputes affecting homeowners and commercial developers.
His work is grounded in original legal and regulatory sources, including IRS notices, FERC and CPUC rulings, state court filings, PACER records, and UCC lien databases. He specializes in solar contract disputes, injury and workers’ compensation claims, PACE financing issues, tax equity structures, ITC recapture rules, MACRS depreciation, and federal and state solar policy frameworks.
Morgan’s analysis spans solar litigation, finance structures, and regulatory developments such as the IRA and OBBBA, interconnection reform, domestic content rules, and battery storage incentives. He also covers EPC contracts, PPAs, project financing, and utility-scale solar investment structures.