Average Solar Panel Cost per kW USA – 2026 Pricing
The average solar panel cost USA in 2026 sits between $2,500 and $3,500 per kilowatt for a fully installed residential system before any incentives are applied. That range sounds manageable until you realize a 7kW system at the low end costs around $17,500 and at the high end costs $24,500, a $7,000 gap on the same size system, depending entirely on where you live and what your roof looks like. If you are trying to budget for solar, the national average is a starting point, not a final answer. Your state, your electricity rate, and your roof’s specific characteristics all pull that number in different directions.
What most pricing articles skip is the explanation of why two homes in the same city can receive quotes that differ by $4,000 or more. Labor rates, local permitting costs, utility interconnection fees, and roof complexity all affect the final invoice in ways that the per-kilowatt figure does not capture. This article breaks down the real cost structure, so you know exactly what you are paying for before any installer puts a number in front of you.
What a Solar System Actually Costs in 2026: By State
State-level pricing differences are driven by labor costs, permitting requirements, and market competition. High-demand states with large solar markets tend to have more competitive pricing. States with complex permitting processes or higher labor costs tend to run more expensively. Here is where each major state sits in 2026:
| State | Avg Cost Per kW | Typical 7kW System Cost | After 30% Federal Credit | Notes |
| California | $3,100 | $21,700 | $15,190 | Higher labor costs; permitting adds time and cost |
| Massachusetts | $3,000 | $21,000 | $14,700 | Strong installer market; state credit stacks on federal |
| New York | $2,950 | $20,650 | $14,455 | The NY Sun program reduces the upfront cost further |
| Arizona | $2,650 | $18,550 | $12,985 | Competitive market; Phoenix and Tucson have many options |
| Florida | $2,700 | $18,900 | $13,230 | Sales tax exemption removes cost from equipment |
| Texas | $2,600 | $18,200 | $12,740 | Large market keeps prices competitive; no state incentives |
| Illinois | $2,800 | $19,600 | $13,720 | Chicago area labor costs are higher than downstate |
| Kansas | $2,500 | $17,500 | $12,250 | Lower labor costs; fewer installers in rural areas |
These figures represent fully installed systems, including panels, inverters, mounting hardware, wiring, labor, and permitting. The 30 percent federal Investment Tax Credit applies to the full installed cost, which is why the after-credit column is the number that matters most for your actual out-of-pocket budget.
Before you get any installer quotes, running your address through a solar panel cost calculator by zip code gives you a localized estimate based on your actual electricity rate and sun hours rather than a state-level average that may not reflect your neighbourhood.
What Makes Up the Total Cost: Line by Line

The per-kilowatt price bundles several distinct cost categories that most quotes present as a single number. Breaking them apart helps you evaluate whether a specific quote is reasonable or inflated.
Equipment costs typically account for 55 to 65 percent of the total. This includes the solar panels, the inverter that converts DC power to AC for your home, mounting hardware, wiring, and the monitoring system. Inverter type affects cost meaningfully — string inverters are less expensive than microinverters, but microinverters perform better on partially shaded roofs and add $800 to $2,000 to the total.
Labor and installation typically run 20 to 25 percent of the total. This covers the crew time to physically install the system, connect it to your electrical panel, and complete all wiring. Steep roofs, complex layouts, and multi-story homes all increase labor time and cost. Tile roofs specifically add cost because installers must remove and reinstall each tile carefully, which is slow and skilled work.
Permitting, inspection, and utility interconnection typically add 10 to 15 percent. Every jurisdiction requires permits before installation and an inspection after it is completed. Utility interconnection carries its own fees and timeline that vary significantly by utility. In some California cities, this process alone adds $500 to $1,500 to the final invoice, and it is entirely outside your installer’s control.
Not every homeowner who gets a quote will qualify for every incentive available in their state. Confirming who is eligible for solar incentives in the USA before you finalize your budget prevents the common mistake of building a payback calculation around incentives you cannot actually claim.
How System Size Affects Your Total Price and Monthly Savings
System size should be matched to your actual annual electricity consumption, not chosen based on what fits on your roof or what sounds like a round number.
| System Size | Typical Cost Before Credit | After 30% Federal Credit | Est. Annual Savings | Best Fit For |
| 4kW | $10,400 to $13,200 | $7,280 to $9,240 | $600 to $900 | Lower usage homes under 700 kWh per month |
| 6kW | $15,600 to $19,800 | $10,920 to $13,860 | $900 to $1,400 | Average usage homes 700 to 1,000 kWh per month |
| 8kW | $20,800 to $26,400 | $14,560 to $18,480 | $1,200 to $1,800 | Higher usage homes 1,000 to 1,400 kWh per month |
| 10kW | $26,000 to $33,000 | $18,200 to $23,100 | $1,500 to $2,200 | Large homes or homes with EV charging |
Oversizing a system creates a practical problem in states with weak net metering. If your system produces significantly more than you consume and your utility offers low export credits, that excess generation is worth little. Matching system size to your consumption is the stronger financial approach in most markets.
What U.S. homeowners actually save per year with a solar system shows how these system size estimates translate to real annual bill reductions across different states and electricity rates.
City by City: Average Solar Panel Cost USA Across Major Markets
| City | Avg Cost Per kW | Typical 7kW Total | Peak Sun Hours | Annual Savings Estimate |
| Los Angeles, CA | $3,100 | $21,700 | 5.7 hrs per day | $1,900 to $2,200 |
| Phoenix, AZ | $2,650 | $18,550 | 6.5 hrs per day | $1,350 to $1,600 |
| Tampa, FL | $2,700 | $18,900 | 5.5 hrs per day | $1,200 to $1,450 |
| Austin, TX | $2,600 | $18,200 | 5.2 hrs per day | $1,050 to $1,250 |
| Boston, MA | $3,000 | $21,000 | 4.2 hrs per day | $1,600 to $1,900 |
Boston costs more per kilowatt than Phoenix and produces fewer annual kilowatt hours due to lower sun hours. Yet Boston homeowners typically save more per year because Massachusetts charges around 24 cents per kilowatt hour compared to Arizona’s 13 cents. Cost per kilowatt and annual savings are two separate calculations, and both matter when you are evaluating whether the investment makes financial sense for your city.

Arizona deserves a specific mention here. Phoenix gets 6.5 peak sun hours per day, more than any other major U.S. city — which means a properly sized system offsets a very high percentage of annual usage. Why solar panels make strong financial sense in Arizona walks through the specific numbers that make Arizona one of the more compelling solar states in the country, despite its relatively modest electricity rate.
How the Federal Tax Credit Changes the Real Cost You Pay
The 30 percent federal Investment Tax Credit is the most significant financial tool available to U.S. solar homeowners right now. It reduces your federal income tax bill by 30 percent of your total qualified system cost in the year your installation is completed and placed in service.
On a $21,000 system, that is a $6,300 reduction in your federal tax bill. The credit applies to panels, inverters, mounting hardware, installation labor, permitting fees, and battery storage that charges primarily from solar. It does not expire until 2032 under current law, though legislative uncertainty around the Inflation Reduction Act makes confirming the current status worth doing before you sign a contract.
According to the IRS, homeowners claim the Residential Clean Energy Credit on Form 5695 when filing their federal return for the year the system is placed in service. The credit is non refundable; it reduces what you owe rather than generating a cash payment, and unused amounts carry forward to the following tax year automatically.
One thing people often miss is that the installation timeline directly affects which tax year you can claim the credit. A system that starts installation in October but does not receive utility interconnection approval until January of the following year pushes the credit to the next return. How long a home solar installation actually takes in America covers the permitting and interconnection timelines by state, so you can plan your project with the tax year deadline in mind.
The Honest Limitation: Solar Has Real Drawbacks in Some Markets
Solar is not the right financial decision for every home in America, and the cost picture in some states makes that clear.
In Kansas, where electricity averages around 11 cents per kilowatt hour, annual savings on a standard system run $700 to $900. With an after-credit cost of roughly $12,250, the payback period stretches to 13 to 17 years. The system still delivers a positive return over its 25 year lifespan, but the financial case requires patience that not every homeowner is comfortable with.
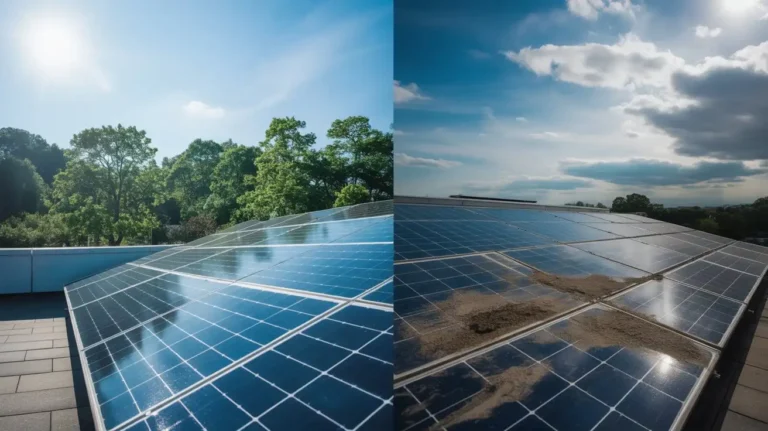
Roof condition is the other variable that changes the cost calculation in ways that surprise people. If your roof is more than 15 years old, installing solar before replacing it is a mistake. Removing and reinstalling a solar system costs $1,500 to $4,000 on top of roofing costs. A roof replacement planned two years after installation is an expensive lesson that could have been avoided with a straightforward inspection upfront.
How solar energy benefits and drawbacks vary across U.S. states gives you the state-specific picture of where the cost and savings balance tips clearly in favor of solar and where it requires more careful evaluation before committing.
Final Thoughts
The average solar panel cost USA in 2026 is not one number; it is a range shaped by your state, your roof, your system size, and the labor market where you live. A $21,000 system in Massachusetts becomes a $14,700 out of pocket cost after the federal credit and drops further with the state income tax credit applied on top. The same size system in Texas costs $18,200 before the credit and $12,740 after, with fewer state programs to reduce it further.
The most important step before getting any quotes is knowing your annual electricity consumption, your roof’s orientation and shading situation, and which incentives you actually qualify to claim. Every dollar spent on a system larger than your consumption requires is a dollar with a longer payback period attached. Price per kilowatt matters, but price per kilowatt relative to what your system will actually save you per year is the number that determines whether this decision makes financial sense for your specific home.
Frequently Asked Questions
What is the average solar panel cost per kW in the USA in 2026?
The national average runs between $2,500 and $3,500 per kilowatt for a fully installed residential system before incentives. After the 30 percent federal tax credit, most homeowners effectively pay between $1,750 and $2,450 per kilowatt.
How much does a standard 7kW solar system cost in the USA?
A 7kW system typically costs between $17,500 and $24,500 before incentives, depending on your state. After the 30 percent federal Investment Tax Credit, the out-of-pocket cost drops to roughly $12,250 to $17,150 for most U.S. homeowners.
Why do solar installation costs vary so much between states?
Labor rates, local permitting requirements, utility interconnection fees, and market competition all drive the differences. California and Massachusetts tend to run more expensively. Texas and Arizona tend to be more competitive due to larger installer markets.
Does roof type affect solar installation cost in the USA?
Yes, significantly. Tile roofs cost more to work with than asphalt shingle roofs because tiles must be carefully removed and reinstalled. Steep or multi-section roofs also increase labor time and total project cost.
What is included in the total solar installation cost?
The full cost includes panels, inverters, mounting hardware, wiring, installation labor, permitting fees, and utility interconnection costs. Battery storage is a separate line item if added to the system.
Does the 30 percent federal tax credit apply to the full installation cost?
Yes. The credit applies to panels, inverters, mounting hardware, installation labour, permitting fees, and battery storage that charges primarily from solar. It reduces your federal tax bill dollar for dollar in the year your system is placed in service.

Morgan Lee is a homeowner and solar energy researcher based in the United States. After installing a rooftop solar system in 2022 and spending months comparing quotes, incentives, and installer reviews, Morgan realized how confusing and overwhelming the process felt for most American families. That experience led to the creation of SolarInfoPath, a no-pressure, educational platform designed to help U.S. homeowners understand solar energy clearly and confidently. Morgan focuses on practical, research-backed information covering solar costs, installation timelines, federal tax credits, and long-term savings. All content on this site is written from a homeowner’s perspective with the goal of making solar energy simple and accessible for everyday Americans.