How Much Do Solar Panels Save Per Year for U.S. Homeowners?
If you are trying to figure out how much do solar panels save per year before committing to an installation, you deserve actual numbers rather than a paragraph that ends with “it depends on your situation.” Your electricity rate, your state’s net metering policy, and how much power your household uses are the three things that shape your annual savings number more than anything else. In my experience, homeowners who understand these three factors walk into the solar decision with realistic expectations and far fewer surprises later.
What surprised me when I started looking at production data from homes across different states is how dramatically the electricity rate shifts the annual outcome, even when sun hours are similar. A homeowner in Massachusetts paying 24 cents per kilowatt hour saves significantly more per year than a homeowner in Kansas paying 11 cents, even if their systems are the same size. That rate difference is the story behind why some states feel like obvious solar wins, and others require more careful math.
Real Annual Savings Numbers by State: No Vague Ranges
Here is the state-by-state breakdown most solar articles skip. These figures are based on a standard 7kW to 8kW residential system, average state electricity rates, and typical net metering policies. Your actual result may be higher or lower depending on your roof, usage habits, and specific utility.
| State | Avg Rate | Est. Annual Savings | Payback Period | Key Notes |
| California | 27¢/kWh | $1,900 | 7 to 9 years | High rate drives strong returns; NEM 3.0 changed export credits |
| Massachusetts | 24¢/kWh | $1,700 | 7 to 9 years | Top electricity rates; state income tax credit adds value |
| New York | 21¢/kWh | $1,500 | 8 to 10 years | NY Sun program lowers the upfront cost meaningfully |
| Arizona | 13¢/kWh | $1,350 | 8 to 10 years | Best sun hours in the country; Phoenix averages 6.5 hrs per day |
| Florida | 12¢/kWh | $1,200 | 9 to 12 years | Excellent year round production; reliable net metering in place |
| Texas | 12¢/kWh | $1,100 | 9 to 12 years | Good sun but no statewide net metering; savings vary by utility |
| Illinois | 13¢/kWh | $950 | 10 to 13 years | Strong summer output; Chicago winters reduce December and January production |
| Kansas | 11¢/kWh | $800 | 12 to 15 years | Lower rate stretches payback; fewer state incentives available |
These are not vague ranges designed to cover every possible scenario. They are realistic annual savings estimates for a properly sized system on a typical suburban home in each state. A high-usage household or a home in a particularly sunny location may land 10 to 20 percent above these figures. A smaller system or a shaded roof may come in below them.
Reviewing what solar panels actually cost across the USA before you start comparing these savings figures gives you a clearer picture of how long it takes to reach that break-even point in your specific state.
What Actually Drives Your Annual Savings Number

Your electricity rate is the biggest lever. When you offset one kilowatt hour of electricity with solar production, you save whatever your utility charges for that kilowatt hour. In California at 27 cents, a kilowatt hour is worth 27 cents in savings. In Kansas, at 11 cents, it is worth 11 cents. Same production, very different annual outcome.
Your annual usage is the second factor. A home consuming 15,000 kilowatt hours per year in Texas has more consumption to offset than a home using 8,000 kilowatt hours in the same state with the same system. Larger usage means more potential savings from the same size system, which is why high-consumption households often see the strongest returns on solar investment.
Net metering rules shape how much credit you get for the electricity your panels produce beyond what you use on site. In states with full retail net metering, like New York and Florida, that excess production is credited at the same rate you would pay to buy electricity. In California, under NEM 3.0, new installations receive a reduced export credit. In Texas, there is no statewide policy at all, and each utility sets its own rules. Understanding whether net metering is actually worth it in your state is the right question to ask before assuming your savings estimate accounts for how your utility handles excess generation.
City by City Comparison: Where Annual Savings Are Strongest
| City | Avg Sun Hours Per Day | Est. Annual Savings | Key Solar Notes |
| Los Angeles, CA | 5.7 hrs | $1,950 to $2,200 | High rate makes every kilowatt hour valuable; NEM 3.0 affects new installs |
| Phoenix, AZ | 6.5 hrs | $1,350 to $1,600 | Most sun hours in the country; summer production is exceptional |
| Tampa, FL | 5.5 hrs | $1,150 to $1,400 | Reliable year-round output; statewide net metering policy protects credits |
| Austin, TX | 5.2 hrs | $1,050 to $1,250 | Good sun, but utility rules vary; check your specific provider |
| Boston, MA | 4.2 hrs | $1,600 to $1,900 | Fewer sun hours than southern cities, but the top electricity rate offsets it |
One thing people often miss when comparing cities is that Boston saves more annually than Austin despite getting substantially less sunlight. The reason is entirely the rate difference. Massachusetts charges more than double what most Texas utilities charge, which means each unit of solar production saves more dollars on your bill even when there is less of it.
A Real Dollar Example From a Texas Home
Let’s put a specific household to these numbers. A family in Austin with a monthly electricity bill averaging $185 uses roughly 14,800 kilowatt hours per year at a blended rate of about 12 cents. They install a 7.5kW system with a total cost of $21,000.
After the 30 percent federal Investment Tax Credit, their out-of-pocket cost drops to $14,700. Texas offers no additional state incentives beyond the federal credit, so that is the full picture on the incentive side.
Their system produces approximately 10,500 kilowatt hours in its first full year, offsetting about 71 percent of their annual usage. At 12 cents per kilowatt hour, that offset translates to roughly $1,260 in annual bill savings. Their estimated payback period is just under 12 years. After that, the remaining system life of 13 or more years runs at essentially no additional cost.
That is an honest Texas scenario. Not spectacular by California standards, but still a genuinely positive long-term financial outcome. Seeing how the solar payback period works across different states shows you exactly why the Texas math looks different from the Massachusetts math and what changes that timeline in your favor.
How System Size Changes Your Annual Savings

A 5kW system and a 10kW system produce very different annual outputs, and the right size for your home depends on your consumption rather than a round number recommendation.
A 5kW system typically offsets 6,000 to 7,500 kilowatt hours per year, depending on your location. For a lower-usage home in Florida or Arizona, that can cover 70 to 80 percent of annual consumption. For a high-usage home in Texas with central air conditioning running heavily in summer, it might only cover 40 to 50 percent.
A 10kW system typically offsets 12,000 to 14,000 kilowatt hours per year. That is appropriate for homes with high usage, electric vehicle charging, pool pumps, or electric water heating. Oversizing relative to your actual consumption can create excess production that earns reduced credit under some net metering structures, which is why matching system size to usage matters more than installing the largest system available.
Looking at what solar panels cost after all incentives are applied at different system sizes helps you understand the cost per kilowatt hour of savings and whether scaling up genuinely improves your financial outcome.
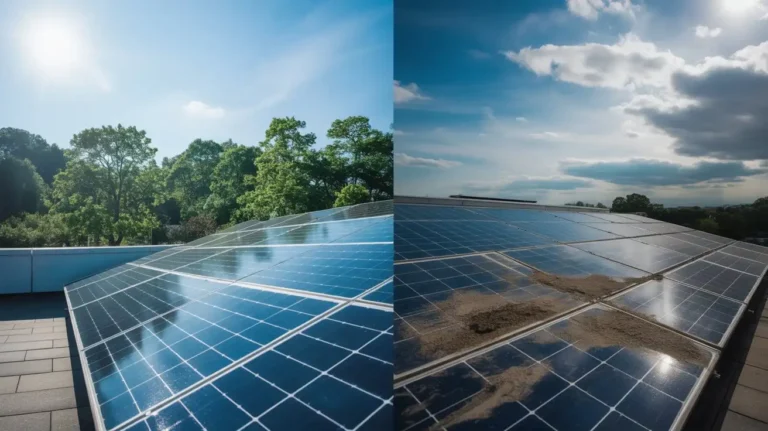
The Honest Limitation: Why Annual Savings Vary Even Within the Same State
I have seen two homes in the same Arizona city with the same 7kW system installed by the same crew produce noticeably different annual savings. The reason was shading. One home had a large tree to the southwest that cast afternoon shade across part of the array. The other had an unobstructed south-facing roof. The difference in annual production was about 18 percent, which translated directly into lower savings on the shaded home.
Roof direction is the other variable that changes real-world results. South-facing roofs at a 30-degree pitch produce the highest annual output across most of the continental United States. East or west-facing roofs typically produce 10 to 20 percent less annually. Some states with time-of-use pricing make west-facing installations financially comparable because they capture high-value late afternoon production, but that depends entirely on your utility’s rate structure.
According to the U.S. Department of Energy, residential solar production estimates should account for local shading, roof orientation, and panel degradation over time. Panel efficiency typically degrades at about 0.5 percent per year, so a system producing 10,000 kilowatt hours in year one will produce roughly 9,500 in year ten. That slow decline is built into long-term savings projections and is not a reason for concern, but it is worth understanding.
Deciding whether solar panels are worth it for your specific home requires putting your state rate, your roof situation, and your usage together rather than relying on a national average that may not reflect your actual outcome.
Final Thoughts
How much do solar panels save per year for U.S. homeowners? The real answer, backed by actual state data, runs from about $800 per year in lower-rate states like Kansas to $1,900 or more in high-rate states like California and Massachusetts. Your electricity rate drives that range more than your latitude on a map. A home in Boston with 4.2 peak sun hours per day saves more annually than a home in Austin with 5.2 peak sun hours, purely because Massachusetts charges more than double the electricity rate.
Annual savings are real and consistent for most U.S. homeowners, but they are not identical across states, and they are not immune to the variables on your specific property. Roof direction, shading, usage habits, and your state’s net metering policy all shape where your home lands within your state’s typical range. If your electricity rate is above 15 cents per kilowatt hour, your roof faces south with minimal shading, and you qualify for the federal credit, the annual savings case is genuinely strong.
FAQs
How much are the average yearly savings from solar panels?
In my experience, many U.S. homeowners save between $1,000 and $2,000 per year. You may notice higher savings in states with expensive electricity.
How accurate is a solar panel annual savings calculator?
It depends on your inputs. I wouldn’t say it’s perfect, but it usually gives a realistic estimate if your usage data is accurate.
How much money do solar panels save monthly?
Monthly savings often range from $80 to $200, depending on your bill size. Higher utility rates generally mean stronger savings.
Do solar panels eliminate my electric bill?
Usually not. You may still pay small grid connection fees or seasonal charges, especially in the winter months.
Do solar panels save on the electric bill, and how much in winter?
Savings are typically lower in winter due to shorter daylight hours. In my experience, production still helps, just not at summer levels.
Are solar savings the same in every U.S. state?
No, they vary widely. States like California and New York often see stronger returns than lower-rate states like Kansas or Alabama.

Morgan Lee is a homeowner and solar energy researcher based in the United States. After installing a rooftop solar system in 2022 and spending months comparing quotes, incentives, and installer reviews, Morgan realized how confusing and overwhelming the process felt for most American families. That experience led to the creation of SolarInfoPath, a no-pressure, educational platform designed to help U.S. homeowners understand solar energy clearly and confidently. Morgan focuses on practical, research-backed information covering solar costs, installation timelines, federal tax credits, and long-term savings. All content on this site is written from a homeowner’s perspective with the goal of making solar energy simple and accessible for everyday Americans.