
Commercial solar panel installation cost in 2026 ranges from approximately $1.40 to $2.55 per watt for most rooftop systems, with DOE-affiliated benchmark data from early 2025 placing a modeled 250 kWdc reference system at roughly $1.95 to $1.98 per watt before incentives. After the 30% federal Investment Tax Credit and MACRS depreciation, many U.S. businesses reduce their net cost by 45% to 55% of the gross price, depending on tax structure and project location.
Most business owners searching for commercial solar pricing have already seen a quote that surprised them. Maybe it was higher than expected. Maybe two quotes differed by 40% with no clear explanation. That confusion is not a sign of a bad market. It is a sign that commercial solar costs depend on a large number of variables that most guides never untangle.
This guide covers the full cost picture: what drives price, how size affects cost per watt, what tax incentives actually change the math, which financing structure preserves the most savings, and what a realistic payback calculation looks like from start to finish.
How Much Does Commercial Solar Panel Installation Cost in 2026?
The national installed cost for commercial solar panel installation in 2026 runs between $1.40 and $2.55 per watt for most rooftop systems, with ground-mount and carport installations running higher because of structural and land-preparation costs. The DOE-affiliated National Laboratory of the Rockies published Q1-2025 benchmark data placing a modeled 250 kWdc rooftop reference system at approximately $1.95 to $1.98 per watt. That figure represents a reference model, not a guaranteed market quote, but it is the most authoritative benchmark available from a primary source.
Competitor guides often show ranges as wide as $1.10 to $3.80 per watt for similar system sizes. The reason those figures vary so dramatically is that they come from different system sizes, different scopes of work, different regions, and different publication dates. A figure from 2022 at a different system size is not a valid comparison point for your 2026 project.
How Does Commercial Solar Price Vary by System Size?
Commercial solar price drops as system size increases. That relationship is not linear. The fixed costs of a project, including engineering, permitting, interconnection studies, and project management, are spread across more watts as the system grows. Larger systems also attract more competitive bids from installers.
The table below reflects estimated installed cost ranges for common commercial system sizes in 2026, before any federal or state incentives, based on published industry benchmarks and DOE reference data. These are ranges, not guarantees, and actual quotes vary by region, equipment tier, roof condition, and interconnection scope.
| System Size | Estimated Cost Range Per Watt | Estimated Total Gross Cost |
| 25 kW | $2.20 to $3.00 | $55,000 to $75,000 |
| 100 kW | $1.80 to $2.40 | $180,000 to $240,000 |
| 250 kW | $1.60 to $2.10 | $400,000 to $525,000 |
| 500 kW | $1.50 to $1.90 | $750,000 to $950,000 |
| 1 MW and above | $1.40 to $1.70 | $1,400,000 and up |
These figures include hardware (modules, inverters, racking, balance of system) and standard soft costs (labor, permitting, engineering). They typically do not include structural roof upgrades, transformer modifications, or interconnection fees beyond the basic application cost.
How Does Commercial Solar Price Compare Per Square Foot vs Per Watt?
Commercial solar price is most usefully measured per watt, not per square foot. The reason is panel efficiency. A higher-efficiency monocrystalline panel produces more watts per square foot than a lower-efficiency polycrystalline panel. Two quotes with the same per-square-foot price could represent very different system capacities and total outputs.
A rough conversion: a standard commercial rooftop installation uses approximately 70 to 100 square feet of roof space per kilowatt of capacity, depending on panel type and layout. A 250 kW system typically requires 17,500 to 25,000 square feet of usable roof area. Use per square foot as a quick space check. Use per watt to compare costs between quotes.
What Is Your Real Commercial Solar Cost After Federal Incentives?
Your real commercial solar cost after the 30% federal Investment Tax Credit and MACRS depreciation can be 45% to 55% below the gross installation price, depending on your effective tax rate and project-specific bonus adder eligibility. Those incentives do not appear on day one. The ITC is claimed on your federal tax return for the year the system is placed in service. MACRS depreciation is claimed over 5 years using the modified accelerated cost recovery schedule.
A business owner reviewing a $500,000 gross installation quote should not compare that number directly to their monthly electricity bill. The relevant comparison is the net cost after incentives, which for many taxable businesses falls in the $240,000 to $280,000 range. That net figure is what drives the payback period and ROI calculation.
What Drives Commercial Solar Cost and Industrial Solar Installation Cost the Most?
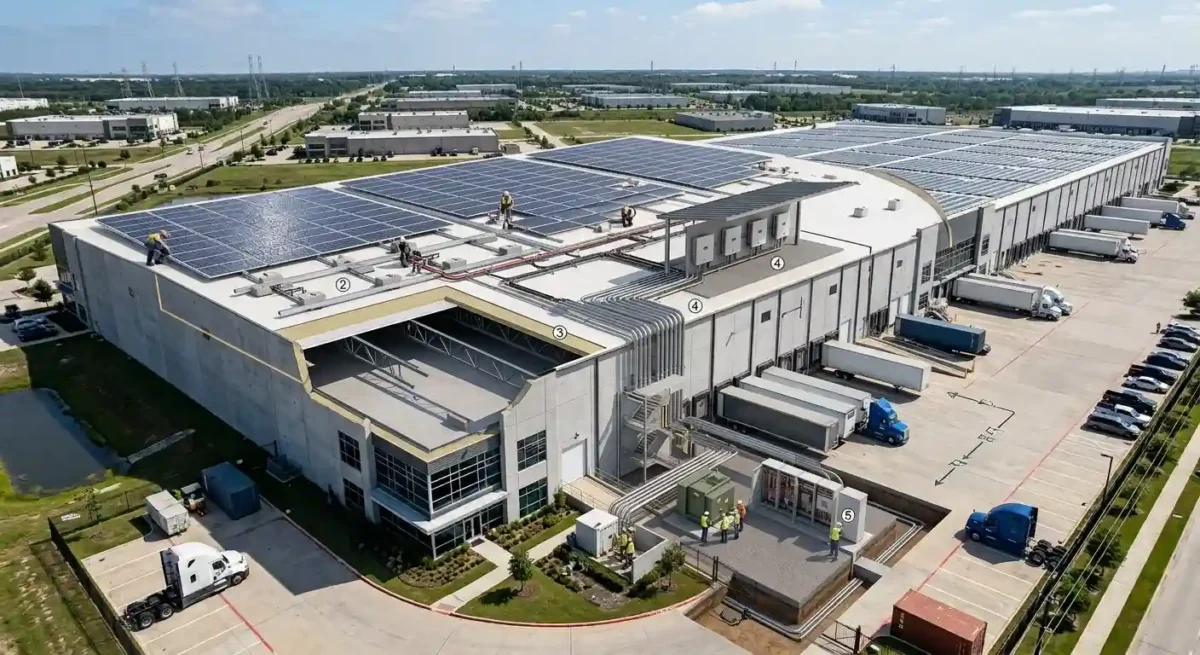
Five variables drive more cost variation than any others: system size, roof or site condition, mounting type, interconnection scope, and regional labor rates. Understanding each one lets you evaluate whether a quote is reasonable or outlying before you respond to an installer.
System size is the single largest driver of cost per watt. As explained above, economies of scale reduce the per-watt figure substantially above 100 kW.
Roof condition is the most common hidden cost driver. Many commercial buildings have flat roofs with aging membranes or limited load capacity. A structural engineering assessment before installation may identify the need for roof reinforcement, membrane replacement, or ballast weight limits that reduce usable roof area. Budget $10,000 to $50,000 for roof-related work on older buildings, depending on size and condition.
Mounting type affects both cost and engineering complexity. Ballasted flat roof systems cost less per watt than rail-mounted pitched roof systems, which in turn cost less than ground-mount or carport structures. Carport and ground-mount systems add $0.30 to $0.80 per watt in structural costs over basic rooftop.
Interconnection scope is the variable most often excluded from initial quotes. Interconnection fees charged by the utility, transformer upgrade requirements, and switchgear modifications can add $20,000 to $150,000 to a project depending on the building’s existing electrical infrastructure and the local utility’s grid capacity. Ask whether interconnection costs are included before comparing any two bids.
Regional labor varies by union versus non-union markets, local permitting requirements, and installer competition. Markets with fewer commercial installers tend to run 15% to 25% higher in soft costs than competitive markets.
How Does Industrial Solar Installation Cost Differ From Commercial?
Industrial solar installation cost typically runs higher per watt than standard commercial because industrial facilities usually require larger system capacity, more complex switchgear and transformer work, and higher-grade electrical infrastructure to connect at the voltage level the facility operates. A manufacturing plant running 3-phase power at 480V requires different interconnection engineering than a retail building on a standard commercial service.
The per-watt premium for industrial versus commercial installation is typically $0.20 to $0.50 per watt, driven primarily by electrical scope rather than module or racking costs, which are similar across both categories.
What Hidden Costs Go Beyond the Base Business Solar Installation Cost?
The base business solar installation cost quote from most installers covers equipment, labor, and standard permitting. Several cost categories regularly appear as change orders or are excluded from the initial proposal:
- Structural roof assessment and reinforcement: $5,000 to $50,000, depending on roof age and condition
- Transformer upgrade: $15,000 to $80,000 if the utility requires service capacity upgrades at the point of common coupling
- Switchgear modification: $10,000 to $40,000 for older facilities with outdated electrical panels
- Interconnection study fee: $2,000 to $20,000 paid to the utility, separate from installation costs
- Permit and plan review fees: $2,000 to $15,000 depending on jurisdiction
- Roof membrane replacement: If required before mounting, $8 to $20 per square foot
Ask any installer to confirm in writing what is and is not included in the quoted price before signing. Review the commercial solar contract terms and exit rights if a signed agreement does not match what was verbally quoted.
How Do You Finance a Business Solar Installation Cost Project?
Business solar installation cost can be funded through four main structures: cash purchase, commercial solar loan, C-PACE financing, and a power purchase agreement or operating lease. Each creates different ownership rights, different tax treatment, and different monthly cash flow profiles. The right structure for your business depends on your tax appetite, available capital, and how long you plan to hold the property.
| Structure | Ownership | Who Claims ITC | Upfront Capital | Best Fit |
| Cash purchase | Business | Business | Full cost | Strong tax appetite, available capital |
| Commercial solar loan | Business | Business | Low or none | Tax appetite, prefer to preserve liquidity |
| C-PACE financing | Business | Business | None | Property secured, long repayment term |
| PPA or lease | Developer | Developer | None | No tax appetite, prefer fixed rate |
What Is C-PACE Financing and Is It Available in Your State?
C-PACE, or Commercial Property Assessed Clean Energy financing, attaches the repayment obligation to the property rather than to the business as personal debt. The loan is repaid through a special assessment on the property tax bill, typically over 20 to 30 years. Because it is a property obligation, it transfers when the property sells.
C-PACE availability varies by state and sometimes by county. The programs offered in California, Colorado, and Texas differ significantly in loan terms, eligible improvements, and maximum financing amounts. Verify current availability and program terms through your state’s energy office or PACENation’s program directory before assuming C-PACE is an option for your project.
One important tax note: because C-PACE does not constitute personal debt, it does not appear on the business’s balance sheet in the same way as a commercial loan. That has potential accounting implications worth discussing with a CPA before choosing this structure.
Should a Nonprofit or Municipality Use a PPA or Elective Pay?
Tax-exempt entities including nonprofits, municipalities, schools, and tribal governments cannot directly use the Investment Tax Credit because they have no federal income tax liability to offset. Two mechanisms in the Inflation Reduction Act address this.
Elective pay, created under Section 6417 of the Internal Revenue Code, allows tax-exempt entities to receive the ITC as a direct cash payment from the Treasury instead of a tax credit. The entity owns the system and receives the credit value as cash. This is a significant change from earlier law, which left tax-exempt buyers dependent on third-party ownership structures.
A power purchase agreement allows a third-party developer to own the system, claim the ITC through their own tax liability, and pass a portion of the savings through to the nonprofit in the form of a below-market electricity rate. For entities that cannot or do not want to own the asset, a PPA remains the standard alternative.
Review how solar contract terms affect your obligations before signing any PPA or lease agreement, particularly if the contract runs 20 to 25 years and includes escalator clauses or buyout provisions.
What Tax Incentives Reduce the Total Cost in 2026?
The federal Investment Tax Credit provides a base credit of 30% of the qualified cost of a commercial solar energy system placed in service in the United States. That base rate applies to systems that meet prevailing wage and apprenticeship requirements for projects above 1 megawatt. Systems below 1 MW are exempt from those requirements.
Three bonus adders can increase the ITC above 30%. The domestic content adder adds 10% for systems using qualifying U.S.-manufactured components. The energy community adder adds 10% for projects sited in defined energy communities, including coal transition areas and certain brownfield sites.
The low-income communities bonus can add up to 20% for qualifying projects under the Section 48E(h) program, which has an annual capacity cap. Stacking the domestic content and energy community adders brings the base credit to 50% for eligible projects.
MACRS depreciation allows businesses to depreciate the solar system over a 5-year schedule using the Modified Accelerated Cost Recovery System. Bonus depreciation, which allows a higher percentage to be expensed in year one, phases down annually under current law. Confirm the current bonus depreciation percentage with a CPA, as it has changed multiple times in recent years and the applicable rate depends on when the system is placed in service.
The interaction between ITC and MACRS requires one important calculation. The depreciable basis of the system is reduced by half the ITC amount. On a $500,000 system claiming a 30% ITC ($150,000 credit), the depreciable basis for MACRS is $500,000 minus $75,000, or $425,000. That basis reduction is not widely explained in commercial solar marketing materials, and missing it produces an overstated depreciation benefit.
What Is the Difference Between Begin Construction and Placed in Service?
Begin construction and placed in service are two legally distinct milestones that affect whether and when a project qualifies for the federal tax credit. This is the most misunderstood concept in commercial solar finance, and the 2026 deadline environment makes it especially consequential.
| Concept | Definition | 2026 Deadline |
| Begin construction | Physical work of significant nature commences, or 5% safe harbor paid | July 4, 2026 under the One Big Beautiful Budget Act |
| Placed in service | System is operational and connected to the grid | December 31, 2027 for projects beginning construction after July 4, 2026 |
| Continuity requirement | Construction must proceed continuously without interruption | Project-specific; verify with tax counsel |
IRS Notice 2025-42 provides current guidance on how these rules apply under the One Big Beautiful Budget Act. Projects that began construction before July 4, 2026 are generally subject to different rules than those starting after that date. Confirm your specific situation with a qualified tax professional. Do not rely on an installer’s representation of deadline compliance.
The practical implication: if your project has not yet begun construction and you want to preserve ITC eligibility, time is a material variable in your decision. Interconnection queue backlogs, which currently run 6 to 24 months at many utilities, can push a placed-in-service date beyond the applicable deadline if construction does not begin on schedule.
What Bonus Adders Can Increase the Federal Credit Above 30%?

Three bonus adders are available to qualifying commercial solar projects under current federal law. Each is subject to specific eligibility criteria and documentation requirements.
The domestic content adder of 10% applies when a defined percentage of the steel, iron, and manufactured components in the system are produced in the United States. FEOC, or Foreign Entity of Concern, rules create additional restrictions on equipment from certain countries, affecting module and battery sourcing decisions.
The energy community adder of 10% applies when the project is sited in an energy community as defined by Treasury guidance. Energy communities include census tracts with coal mine or coal power plant closures, areas meeting fossil fuel employment thresholds, and certain brownfield sites. The DOE maintains a mapping tool to check eligibility for specific locations.
The low-income communities bonus of up to 20% applies to projects in qualified census tracts or serving low-income housing. This program has an annual capacity cap under Section 48E(h), and applications must be submitted to the IRS for allocation. Not every eligible project will receive an allocation in a given year.
What Is the Real ROI and Payback Period?
Payback periods for commercial solar projects commonly range from 3 to 10 years depending on system cost, local electricity rates, demand charge structure, and the tax incentives captured. A project that reduces a business’s commercial utility bill by $80,000 per year at a net cost of $280,000 after incentives reaches simple payback in approximately 3.5 years. A project at the same net cost that reduces the bill by $35,000 per year takes closer to 8 years.
Here is the most important thing most articles skip. Demand charges can represent 30% to 70% of a commercial electricity bill. Solar panels alone reduce energy consumption charges, not demand charges.
Battery storage systems, which add $100,000 to $400,000 depending on capacity, are required to achieve meaningful demand charge reduction. For businesses where demand charges are the largest line item, the ROI calculation changes significantly depending on whether storage is included.
Worked Example: 250 kW Rooftop System, Nashville Manufacturing Facility
A manufacturing business in Nashville, Tennessee, pays $11,500 per month to Nashville Electric Service, including $4,200 in demand charges and $7,300 in energy charges. They install a 250 kW rooftop solar system at $1.90 per watt, for a gross cost of $475,000.
- Gross installation cost: $475,000
- Federal ITC at 30%: $142,500 credit
- Depreciable basis after ITC reduction: $475,000 minus $71,250 = $403,750
- MACRS Year 1 depreciation at 20% of basis: $80,750 (at 25% effective tax rate, saves $20,188)
- Effective net cost after ITC and Year 1 depreciation tax savings: approximately $312,000
- Estimated annual energy charge reduction: $52,000 (based on 5-year average Tennessee commercial electricity rate and 4.5 peak sun hours per day average)
- Simple payback on energy savings alone: approximately 6 years
- If demand charges are also partially reduced through time-of-use shift, payback could shorten to 4.5 to 5 years
This example states all assumptions. Every number is labeled. Any ROI projection that does not show its math the same way should be treated with caution.
What I noticed when reviewing commercial solar proposals from 2023 and 2024 is that demand charge reduction is regularly overstated in sales projections. A pure solar system without storage provides limited demand charge benefit. If a proposal shows large demand charge savings without battery storage, ask the installer to explain the mechanism in writing.
How Do You Compare Multiple Commercial Solar Quotes?
Most businesses receive two to four competing commercial solar quotes. Those quotes frequently differ by 20% to 40% in total price with no explanation provided. The differences are usually in scope, not in price gouging. One installer includes the transformer upgrade. Another excludes it. One uses a 25-year panel warranty. Another uses a 10-year product warranty with a separate 25-year performance guarantee.
Comparing quotes without a line-by-line framework produces a false price comparison. Use this checklist before evaluating any bid:
Scope:
- Is the transformer upgrade included or excluded?
- Are interconnection fees included or estimated separately?
- Is structural engineering and any roof reinforcement included?
- Is the permitting and plan review fee in the quote?
Equipment:
- What panel efficiency and warranty does each quote specify?
- What inverter type is proposed, and what is the manufacturer warranty term?
- Does the quote include monitoring equipment and a production guarantee?
Timeline:
- What is the estimated start-of-construction date?
- What is the estimated placed-in-service date, and does it qualify for the applicable ITC rules?
Contract terms:
- Does the contract include a lien waiver provision?
- What are the change order terms?
- What happens if the system underperforms the production estimate?
If a quote is significantly lower than the others without explanation, ask for a written itemized cost breakdown. A low bid that excludes transformer work or uses lower-grade equipment is not cheaper. It is an incomplete scope.
For businesses that have already signed a commercial solar contract and discovered issues with undisclosed costs or misrepresented performance, review your options for addressing solar contract disputes before assuming the problem is unavoidable.
What Ongoing Maintenance Costs Should You Expect?
Commercial solar systems require minimal but real ongoing maintenance over their operating life. The highest long-term cost after installation is inverter replacement, which typically occurs 10 to 15 years into the system’s life at a cost of $8,000 to $30,000 depending on system size and inverter type.
| Maintenance Category | Typical Cost | Frequency |
| Annual inspection | $500 to $2,500 | Annually |
| Panel cleaning | $0.05 to $0.15 per watt | 1 to 4 times per year |
| Inverter replacement | $8,000 to $30,000 | Once, at 10 to 15 years |
| Battery replacement (if included) | $50,000 to $200,000 | Once, at 10 to 15 years |
| Monitoring and remote diagnostics | $500 to $2,000 per year | Ongoing |
| Roof inspection after install | $1,000 to $3,000 | Every 3 to 5 years |
Commercial solar systems come with multiple overlapping warranties: a manufacturer product warranty (typically 10 to 25 years), a performance degradation warranty (typically 25 years guaranteeing minimum output), and an installer workmanship warranty (typically 1 to 10 years). Read what a solar warranty actually covers before assuming all warranties provide equal protection. They do not.
Total maintenance cost over a 25-year system life, including one inverter replacement, typically runs $80,000 to $150,000 for a 250 kW system. Including that figure in your total cost of ownership analysis, alongside installation cost and incentives, produces a more accurate lifetime ROI picture than the simple payback period alone.
What the Cost Comparison Tells You Before You Sign
A commercial solar panel installation cost project is a long-term capital commitment. The variables that matter most are not the ones installers emphasize in a sales presentation. The per-watt headline price is only meaningful once you know what it includes. The monthly savings projection is only meaningful once you know whether demand charges are addressed. The payback period is only meaningful once you account for net incentives and maintenance costs over the full system life.
Two decision checkpoints that every business owner should hit before signing:
First, verify that your effective tax rate is high enough to use the ITC in the year the system is placed in service. If your business had a low-tax year or carries losses, the credit may need to be carried forward, which delays the economic benefit. Discuss with a CPA before using the credit in your payback calculation.
Second, confirm that the begin construction deadline in your installer’s proposed timeline actually satisfies current IRS requirements under IRS Notice 2025-42. An interconnection delay that pushes your placed-in-service date past the applicable deadline could eliminate the ITC eligibility for your project.
The U.S. Department of Energy’s commercial solar resources and the National Renewable Energy Laboratory’s cost benchmark data are the two primary sources worth reviewing before finalizing any project decision. Both are publicly available and free to access.
FAQs About Commercial Solar Panel Installation Cost
What is the average commercial solar cost per watt in 2026?
The DOE benchmark for a 250 kWdc rooftop reference system runs approximately $1.95 to $1.98 per watt in early 2025 data. Smaller systems (25 kW) tend to run $2.20 to $3.00 per watt. Larger systems (500 kW and above) can reach $1.40 to $1.70 per watt. All figures are before incentives.
How much does a 100 kW commercial solar system cost?
A 100 kW commercial rooftop system typically runs $180,000 to $240,000 before incentives in 2026. After the 30% ITC and MACRS depreciation, the net cost for a taxable business often falls to $95,000 to $140,000, depending on the effective tax rate and project-specific adder eligibility.
What is included in cost per watt and what is usually extra?
Standard cost per watt figures include modules, inverters, racking, balance of system components, labor, permitting, and engineering. They typically exclude transformer upgrades, switchgear modifications, roof structural reinforcement, utility interconnection fees, and battery storage systems.
Can a nonprofit or government entity benefit from solar tax credits?
Yes. Section 6417 elective pay allows tax-exempt entities to receive the Investment Tax Credit as a direct cash payment from the Treasury. This replaced the earlier requirement to use a third-party ownership structure. Nonprofit eligibility and application procedures should be confirmed with a tax professional before project signing.
What is the payback period for commercial solar?
Payback periods range from 3 to 10 years depending on installation cost, local electricity rates, demand charge structure, and incentives captured. High electricity rate markets with favorable tax situations see faster payback. Low-rate markets with limited tax appetite see longer payback. No single payback figure applies universally.
Is commercial solar cheaper than residential solar per watt?
Yes. Commercial solar is typically less expensive per watt than residential solar because of economies of scale, standardized flat-roof installation, and larger equipment orders. The residential average runs $2.50 to $3.50 per watt installed. The commercial average falls below $2.00 per watt for systems above 100 kW.
This article by SolarInfoPath (2026 research framework) is part of a comprehensive solar knowledge architecture covering all major high-value sectors including legal disputes (installation negligence, contracts, liability, fraud, lawsuits, liens, HOA and permitting disputes), financial structures (loans, PPA/lease agreements, DSCR financing, tax equity, investment and project finance), tax law (ITC, Section 48/25D, MACRS depreciation, bonus credits, IRS audits, recapture rules, domestic content and IRA/OBBBA compliance), insurance and risk (property damage, hail/wind/fire claims, bad faith insurance disputes, warranty coverage), policy and regulation (net metering, FERC interconnection, state utility rules, incentive programs and regulatory changes), commercial and utility-scale development (EPC contracts, construction delays, performance bonds, receivership, bankruptcy, asset sale and restructuring), real estate impacts (home value, solar leases, liens, title issues, HOA restrictions, easements), and emerging market structures such as battery storage, community solar, agrivoltaics, SRECs, yieldcos, and institutional investment funds. All content is based on publicly available regulatory, financial, and legal sources and is intended strictly for educational and informational purposes, not legal, tax, or financial advice. Readers should always verify current laws, utility policies, tax regulations, and contract terms with qualified licensed professionals before making decisions, as solar regulations, incentives, and financial structures frequently change across jurisdictions and time.

Solar Legal Analyst· Policy Researcher· Investigative Finance Writer Lead Analyst & Founder of SolarInfoPath
Morgan Lee is a solar legal analyst, policy researcher, and investigative finance writer with 12+ years of experience in U.S. renewable energy law, IRS tax credit compliance, and solar litigation. He is the founder of SolarInfoPath, a research-driven platform focused on primary-source analysis of solar contracts, tax law, regulatory policy, and industry disputes affecting homeowners and commercial developers.
His work is grounded in original legal and regulatory sources, including IRS notices, FERC and CPUC rulings, state court filings, PACER records, and UCC lien databases. He specializes in solar contract disputes, injury and workers’ compensation claims, PACE financing issues, tax equity structures, ITC recapture rules, MACRS depreciation, and federal and state solar policy frameworks.
Morgan’s analysis spans solar litigation, finance structures, and regulatory developments such as the IRA and OBBBA, interconnection reform, domestic content rules, and battery storage incentives. He also covers EPC contracts, PPAs, project financing, and utility-scale solar investment structures.