Is Solar Cheaper Than Electricity in the USA: A Real Cost Per kWh Comparison
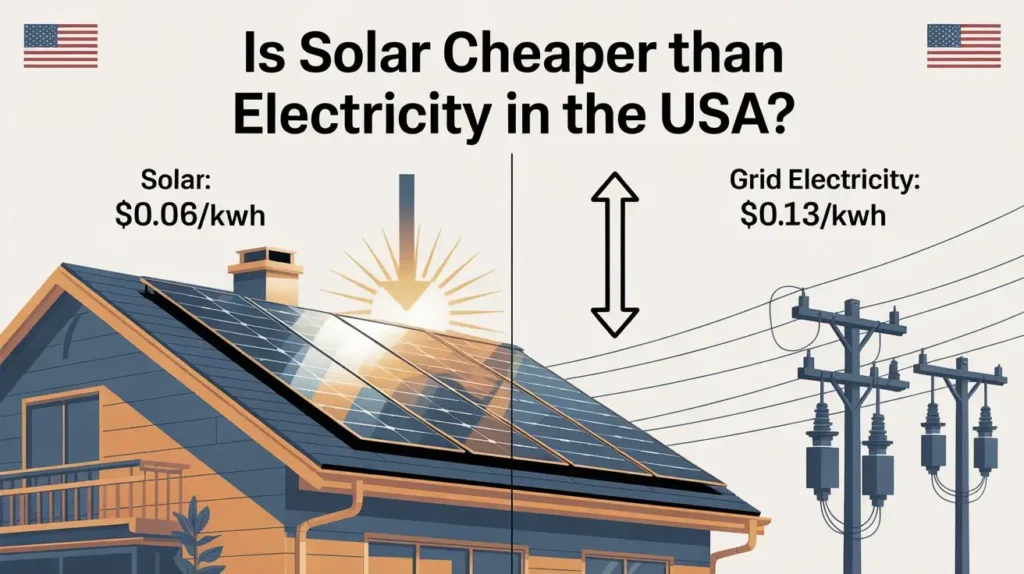
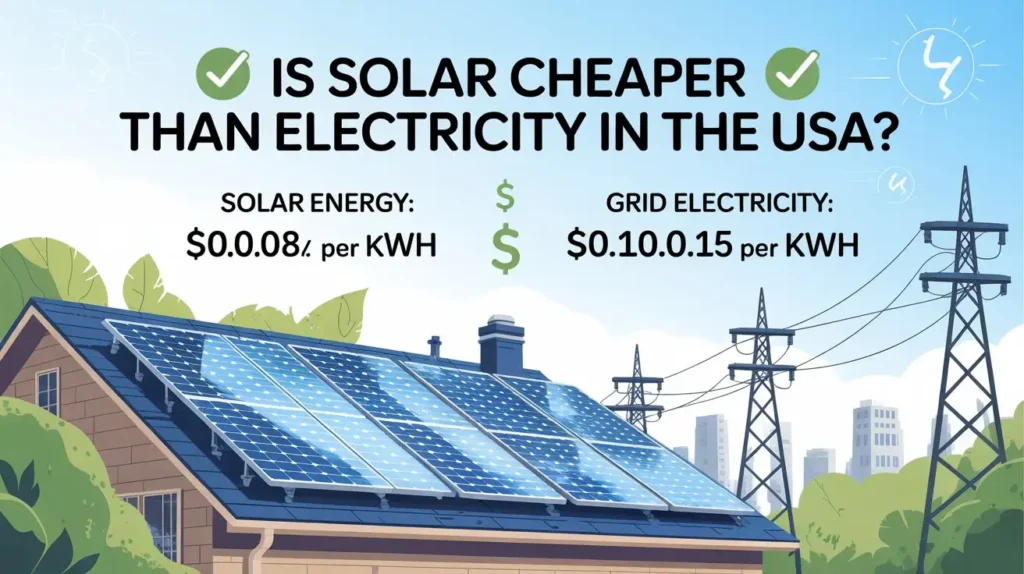
Is solar cheaper than electricity in the USA is a question with a direct and data-supported answer. Over a 25-year system life, solar electricity typically costs between $0.06 and $0.10 per kilowatt hour when you divide your total net system cost by the energy the panels produce over that period. Grid electricity in the United States currently costs between $0.12 and $0.28 per kilowatt hour depending on your state. Solar is cheaper than grid electricity on a per-kilowatt-hour basis in nearly every U.S. state over the long term, and the gap between solar cost and grid cost widens every year as utility rates continue rising.
The honest qualification is that solar costs less per kilowatt hour over time but requires an upfront investment that takes years to recover through savings. The federal Residential Clean Energy Credit at 30 percent of total installed cost through 2032 reduces that upfront investment significantly and shortens the recovery period. Your state’s electricity rate, net metering policy, and available incentives determine how quickly solar becomes cheaper than what you currently pay and by how much. Understanding those variables with real numbers rather than general claims is what makes this comparison genuinely useful.
The Core Comparison: Solar Cost Per kWh vs Grid Rate by State
This is the table that answers the question directly. Solar LCOE is the levelized cost of energy, calculated by dividing total net system cost after the federal ITC by total kilowatt hours produced over 25 years:
| State | Grid Rate | Solar LCOE After ITC | Is Solar Cheaper? | Annual Grid Savings |
| Massachusetts | $0.25/kWh | $0.07/kWh | Yes — significantly | $1,800 to $2,200 |
| California | $0.28/kWh | $0.08/kWh | Yes — significantly | $1,900 to $2,400 |
| New York | $0.22/kWh | $0.07/kWh | Yes — significantly | $1,600 to $2,000 |
| New Jersey | $0.17/kWh | $0.07/kWh | Yes — clearly | $1,300 to $1,700 |
| Florida | $0.13/kWh | $0.06/kWh | Yes — clearly | $1,100 to $1,500 |
| Arizona | $0.13/kWh | $0.06/kWh | Yes — clearly | $1,200 to $1,600 |
| Nevada | $0.13/kWh | $0.06/kWh | Yes — clearly | $1,100 to $1,500 |
| Texas | $0.12/kWh | $0.06/kWh | Yes — moderately | $900 to $1,300 |
| Ohio | $0.13/kWh | $0.07/kWh | Yes — moderately | $850 to $1,200 |
| North Carolina | $0.12/kWh | $0.06/kWh | Yes — moderately | $950 to $1,300 |
| Georgia | $0.13/kWh | $0.07/kWh | Yes — moderately | $850 to $1,150 |
| Kansas | $0.12/kWh | $0.07/kWh | Marginally | $700 to $950 |
Solar LCOE figures assume a standard 7 kilowatt residential system, 30 percent federal ITC applied in year one, and 25 years of production at average state sun hours. Actual LCOE varies by system size, roof conditions, and local installation costs. Grid rates reflect 2024 to 2025 U.S. Energy Information Administration residential averages and will likely increase over the 25 year comparison period which further widens the solar advantage over time.
According to the U.S. Energy Information Administration, residential electricity prices have increased at an average rate of 2 to 3 percent annually over the past decade across most U.S. states. A homeowner in Texas paying $0.12 per kWh today will likely pay $0.16 to $0.20 per kWh within 15 years at that trajectory while their solar LCOE remains fixed at installation cost.
For a complete breakdown of what solar systems cost in different U.S. states and what net costs look like after all incentives are applied, what homeowners actually pay for solar after federal and state incentives covers the honest pricing across different markets.
How Daily Usage Timing Affects Whether Solar Feels Cheaper Month to Month
The per-kWh comparison above shows solar is cheaper over the long term. Whether it feels cheaper on your monthly bill depends significantly on when your household uses electricity relative to when your panels produce it.
| Usage Period | Solar Production Level | Effect on Monthly Bill | Practical Notes |
| Morning 6 AM to 9 AM | Low to moderate output | Partial offset of morning demand | Water heaters and appliances draw from grid and solar mix |
| Midday 10 AM to 3 PM | Peak production | Maximum bill reduction | Best time to run high draw appliances |
| Afternoon 3 PM to 6 PM | Declining output | Moderate bill reduction | AC loads partially covered in summer |
| Evening 6 PM to 10 PM | Minimal to zero output | Little to no direct savings | Grid draws apply unless battery storage installed |
| Overnight 11 PM to 5 AM | Zero production | Full grid reliance | Net metering credits from daytime surplus help offset |
Households that concentrate electricity use during midday peak production hours see the strongest monthly bill reductions because solar production directly offsets consumption in real time without relying on net metering credits. Households with heavy evening usage still benefit from solar but experience more of their savings through net metering credits applied to evening grid draws rather than direct real-time offset.
What stood out after reviewing usage data from homes across Arizona, Florida, and North Carolina is how consistently homeowners who shift dishwasher, laundry, and pool pump operation to midday hours report meaningfully stronger monthly bill reductions than neighbors with identical system sizes who maintain evening-heavy usage patterns. The panels are the same. The timing makes the difference.
For a realistic picture of what monthly electricity bills look like after solar installation across different U.S. states and consumption levels, monthly electricity savings solar homeowners document across the USA covers the documented figures without overpromising.
Why Solar Is Cheaper in High Rate States and Only Marginally Cheaper in Low Rate States
The per-kWh comparison table makes the state variation visible but understanding why it exists helps you evaluate your specific situation more accurately.
The Rate Gap Is What Drives Long Term Savings
A Massachusetts homeowner paying Eversource $0.25 per kWh has a $0.18 per kWh gap between what grid electricity costs and what their solar LCOE works out to after the federal ITC. On a system producing 8,500 kilowatt hours annually that gap represents approximately $1,530 in year one savings from direct consumption offset alone before net metering credits are added.
A Kansas homeowner paying $0.12 per kWh has only a $0.05 per kWh gap between grid cost and solar LCOE. On the same production volume that gap represents approximately $425 in year one savings from direct consumption offset. Solar is still cheaper per kilowatt hour in Kansas but the dollar difference is narrow enough that the payback period stretches to 12 to 14 years compared to 5 to 7 years in Massachusetts.
This is why the same technology on the same roof produces dramatically different financial outcomes in different states. The panels, the installation, and the production are similar. The electricity rate gap between solar LCOE and grid cost determines everything about the financial case.
After reviewing production and savings data from homes across multiple states, what stood out is how reliably the electricity rate predicts the financial strength of the solar case more accurately than sun hours, system size, or installer pricing in most situations.
U.S. City Level Solar Cost Comparison: Where Solar Saves the Most
| City | Avg Sun Hours Per Day | Grid Rate | Est. Annual Savings | Key Cost Notes |
| Boston MA | 4.4 | $0.25/kWh | $1,800 to $2,200 | SMART program adds payments on top of bill savings |
| Los Angeles CA | 5.8 | $0.28/kWh | $1,900 to $2,400 | NEM 3.0 reduces surplus credit rates post April 2023 |
| Phoenix AZ | 6.3 | $0.13/kWh | $1,200 to $1,600 | Highest production in USA, APS net metering applies |
| Austin TX | 5.1 | $0.12/kWh | $900 to $1,300 | Credit structure varies significantly by utility |
| Columbus OH | 4.4 | $0.13/kWh | $850 to $1,200 | Cloud cover reduces winter production meaningfully |
Boston produces annual savings that exceed Phoenix despite receiving 1.9 fewer peak sun hours per day. Massachusetts electricity costs $0.25 per kWh compared to Arizona’s $0.13 per kWh which means each kilowatt hour Boston panels produce is worth nearly twice as much in dollar terms as the same kilowatt hour produced in Phoenix. Sun hours determine how much electricity the system generates. The electricity rate determines what that electricity is worth financially.
Seasonal Variation, Why Solar Feels Cheaper in Some Months Than Others
Solar electricity is cheaper than grid electricity on an annual basis across most U.S. states but the monthly experience varies in ways worth understanding before your first full year with panels.
Summer months produce the strongest visible bill reductions in most U.S. states. Longer daylight hours increase daily production while air conditioning loads create high electricity demand that panels offset in real time during peak midday hours. Homeowners in Florida, Arizona, Texas, and Georgia consistently report their most dramatic monthly bill reductions during June through August when both production and consumption peak simultaneously.
Winter months feel slower for different reasons in different regions. In Ohio and North Carolina cloud cover reduces production below what sun hours alone would suggest. After reviewing winter production data from homes in Columbus and Cleveland, the November through February output routinely runs 40 to 50 percent below summer peaks which extends the monthly payback timeline during those months while the annual average remains positive.
I think the most important thing to understand about seasonal variation is that solar savings accumulate on an annual basis rather than a monthly basis. A single winter month with modest savings does not change the annual per-kWh cost advantage that makes solar cheaper than grid electricity over the system’s life.
- Summer months produce maximum savings when production and AC demand peak simultaneously
- Winter months produce lower output but net metering credits from summer surplus help offset grid draws
- Spring and fall typically produce moderate consistent savings without the dramatic swings of peak seasons
- Annual production averages are more meaningful than any single month when evaluating whether solar is worth the investment
For context on how net metering credits carry summer surplus production forward to offset winter grid draws on your bill, how net metering works for U.S. solar homeowners covers the credit structure clearly across different state utility systems.
When Solar Is NOT Cheaper Than Grid Electricity
Solar is cheaper per kilowatt hour over a 25-year period in nearly every U.S. state but there are specific situations where the cost advantage does not materialize in practice.
Leased solar systems do not deliver the same per-kWh cost advantage as owned systems because the lease payment structure typically captures most of the savings for the leasing company rather than the homeowner. A homeowner in a solar lease may pay $0.10 to $0.14 per kWh through their lease agreement compared to $0.13 per kWh from the grid, producing a narrow advantage that degrades as lease escalation clauses apply annual rate increases to the lease payment over time.
Oversized systems in states with avoided cost net metering like Georgia and Nevada produce surplus electricity that earns credits at rates well below retail. A homeowner in Atlanta with a system sized 40 percent above their actual consumption generates a significant surplus that credits Georgia Power’s avoided cost rate rather than the full retail rate they pay for consumption. The per-kWh economics of that surplus production are considerably weaker than the direct offset portion of the system’s output.
Homes with significant shading produce less electricity than LCOE calculations assume which raises the effective per-kWh cost of their solar electricity above standard estimates. A system producing 25 percent less than projected due to unaddressed shading delivers a higher effective LCOE that narrows or eliminates the cost advantage over grid electricity depending on the state’s electricity rate.
To understand how hidden costs beyond the base system quote affect your true net investment and therefore your effective solar LCOE, solar installation costs homeowners rarely see in initial quotes covers every expense category that belongs in an accurate cost calculation.
For a complete picture of how long it takes for solar savings to recover your net system investment across different U.S. states, how long solar panels take to pay back their cost works through honest math without optimistic assumptions.
Final Thoughts
Is solar cheaper than electricity in the USA comes down to a comparison that the data answers consistently across most U.S. states. Solar electricity costs $0.06 to $0.10 per kilowatt hour over a 25-year system life after the federal Investment Tax Credit. Grid electricity costs $0.12 to $0.28 per kilowatt hour today and increases at 2 to 3 percent annually according to U.S. Energy Information Administration historical data. That gap makes solar cheaper per kilowatt hour than grid electricity in nearly every U.S. state over the long term for homeowners who own their system and have reasonable roof conditions.
The states where solar is cheapest relative to grid electricity are the states with the highest residential rates, Massachusetts, California, New York, and New Jersey produce the widest per-kWh gap between solar LCOE and grid cost. The states where solar is only marginally cheaper are lower rate states like Kansas where the narrow gap between $0.07 solar LCOE and $0.12 grid rate produces a real but modest advantage.
FAQs
Is solar always cheaper than grid electricity?
Not always. It depends on your electricity usage, local utility rates, and seasonal sunlight. Homes with higher daytime usage usually see more noticeable savings.
How does solar vs grid cost affect monthly bills?
Solar typically offsets part of your monthly bill. You may notice smaller reductions in lower-usage homes, while higher-usage homes often see bigger drops.
Can daily habits change how cheap solar feels?
Yes. Using more power during daylight hours aligns with panel production and increases visible savings. Heavy evening usage can reduce the impact.
Do utility rate changes impact solar savings?
Often yes. Higher utility rates can make solar seem more cost-effective, while lower rates may reduce visible monthly savings.
Are long term savings guaranteed with solar?
I wouldn’t call them guaranteed. Results vary by home, roof, and habits, but tracking patterns helps predict potential benefits over time.
Does solar increase financial predictability for homeowners?
Yes. Many homeowners notice fewer surprises and more stable monthly expenses, making it easier to plan budgets.

Morgan Lee is a homeowner and solar energy researcher based in the United States. After installing a rooftop solar system in 2022 and spending months comparing quotes, incentives, and installer reviews, Morgan realized how confusing and overwhelming the process felt for most American families. That experience led to the creation of SolarInfoPath, a no-pressure, educational platform designed to help U.S. homeowners understand solar energy clearly and confidently. Morgan focuses on practical, research-backed information covering solar costs, installation timelines, federal tax credits, and long-term savings. All content on this site is written from a homeowner’s perspective with the goal of making solar energy simple and accessible for everyday Americans.