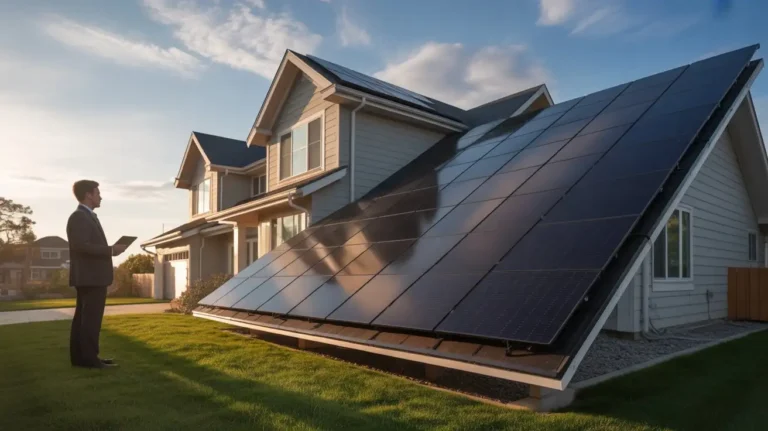
How Much Can You Save With Solar Panels Per Month in the USA?
Let’s skip the runaround. If you’re asking how much can you save with solar panels per month in the USA, you deserve a real answer, not a paragraph that ends with “it depends on many factors.” Most people ask this question because their electricity bill is climbing, and they want to know if solar will actually make a dent in it every single month. The short answer: yes, for most U.S. homeowners,s it does. The longer answer involves your state, your rate, and a few habits that matter more than most people think.
Here’s what I found after going through this process myself and digging into production data from homes across the country. Sunlight matters, but your electricity rate is what really moves the needle on monthly savings. A homeowner in Massachusetts can easily save more per month than someone in sunny Nevada, purely because Massachusetts charges nearly double the rate per kilowatt-hour. That one fact changes how you should think about whether solar makes sense where you live.
The State-by-State Monthly Savings Numbers People Actually Want
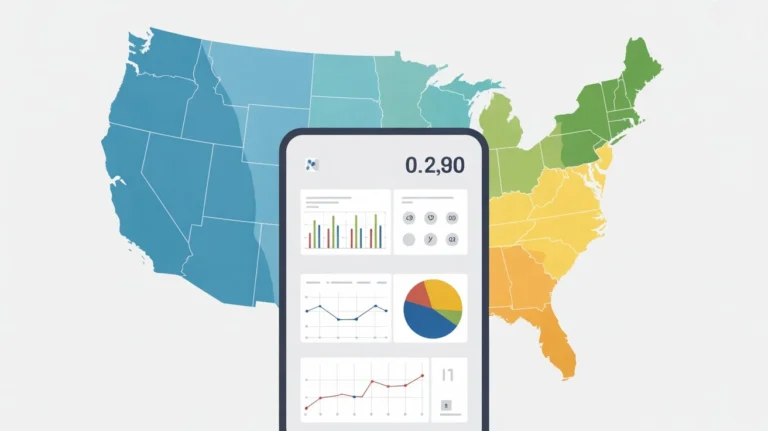
Here it is, the table most solar articles skip, bury, or replace with vague estimates. These numbers are based on average state electricity rates, a standard 6kW to 8kW home solar system, and typical net metering policies in each state.
| State | Electricity Rate | Peak Sun Hours | Est. Monthly Savings | What to Know |
| California | 27¢/kWh | 5.5 hrs/day | $150 – $200 | Top rates in the U.S.; NEM 3.0 reduced export credits for new installs |
| Massachusetts | 24¢/kWh | 4.2 hrs/day | $120 – $155 | Less sun than the South, but saves more — rates are nearly double Texas |
| New York | 21¢/kWh | 4.5 hrs/day | $110 – $145 | The NY-Sun program lowers the upfront cost meaningfully |
| Florida | 12¢/kWh | 5.5 hrs/day | $100 – $130 | Strong sun, solid net metering, dependable year-round output |
| Arizona | 13¢/kWh | 6.5 hrs/day | $110 – $150 | Most sun hours in the country; Phoenix and Tucson lead the state |
| Texas | 12¢/kWh | 5.2 hrs/day | $80 – $105 | No statewide net metering; savings vary a lot by utility |
| Illinois | 13¢/kWh | 4.0 hrs/day | $70 – $90 | Chicago winters pull output down; summer makes up the difference |
| Georgia | 13¢/kWh | 5.0 hrs/day | $85 – $110 | Decent sun but limited state incentives beyond the federal credit |
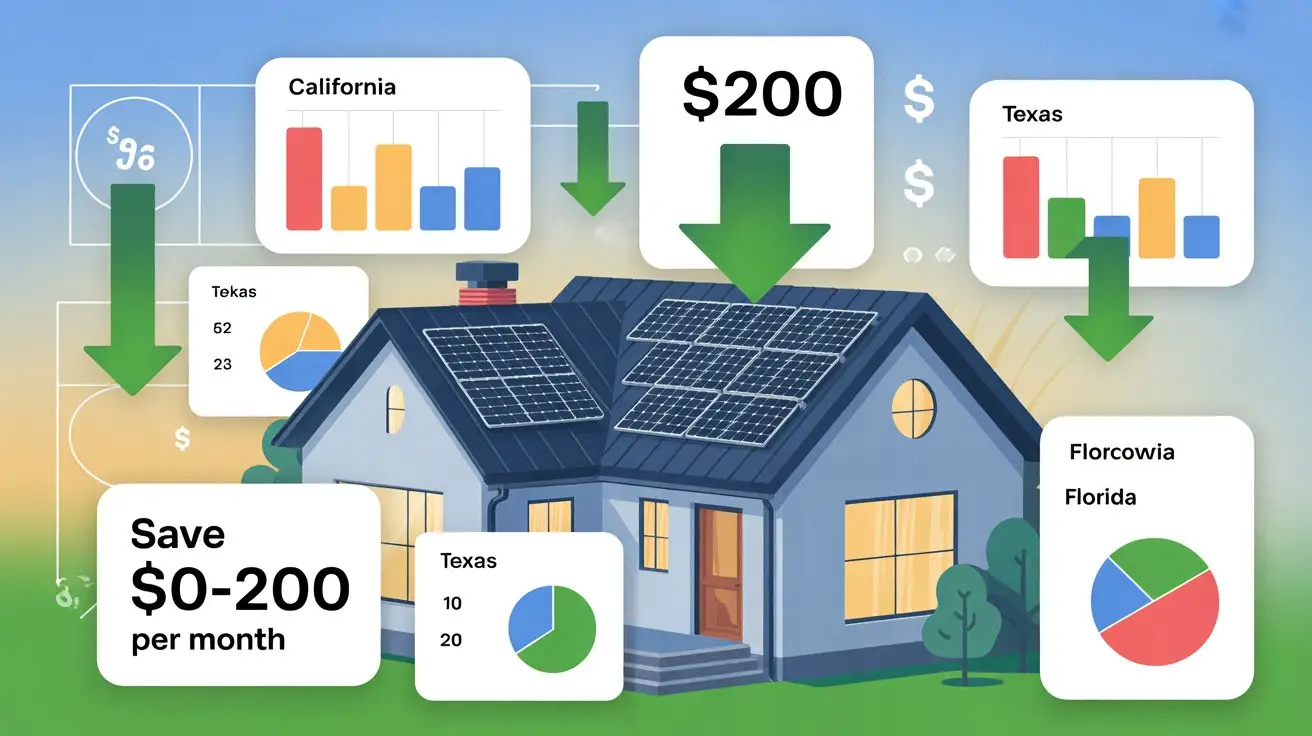
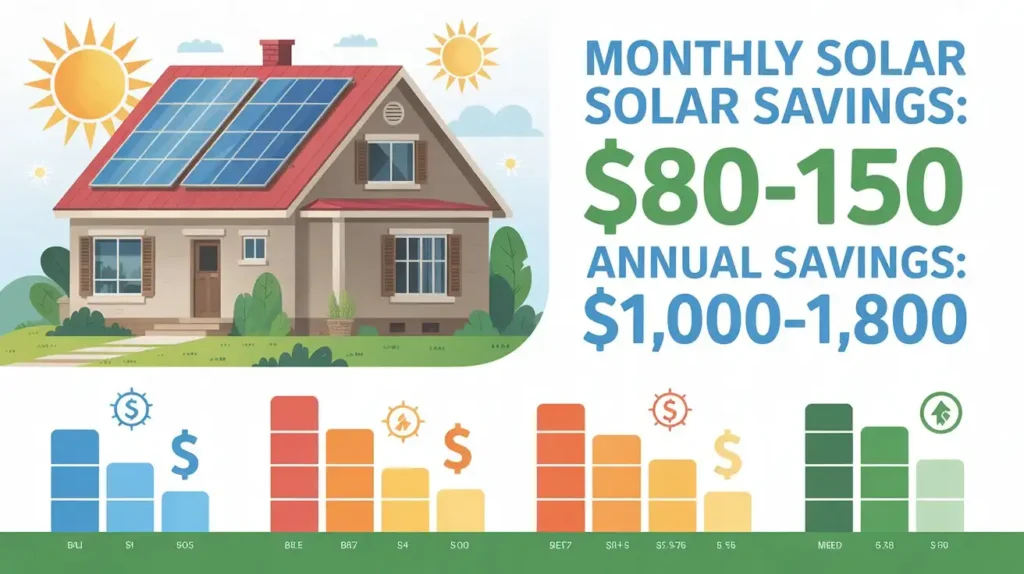
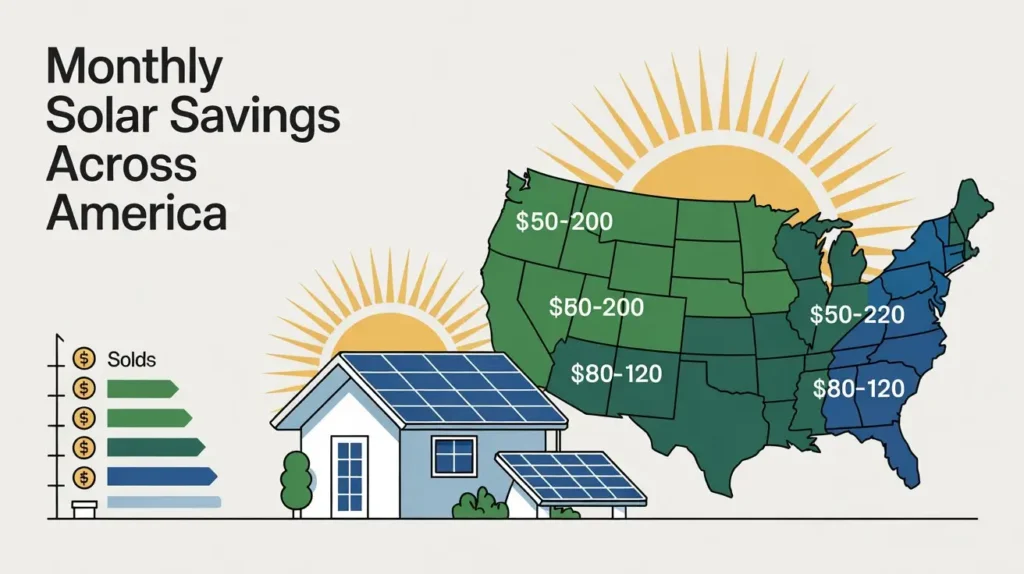
For most U.S. homeowners, monthly savings land between $80 and $150. High-rate states like California, Massachusetts, and New York regularly push toward the top of that range or above it. Lower-rate states like Texas and Illinois tend to sit toward the bottom.
If you’re still getting familiar with how panels actually produce electricity and offset your bill, this plain-language guide to how solar panels work is worth reading before you go any further.
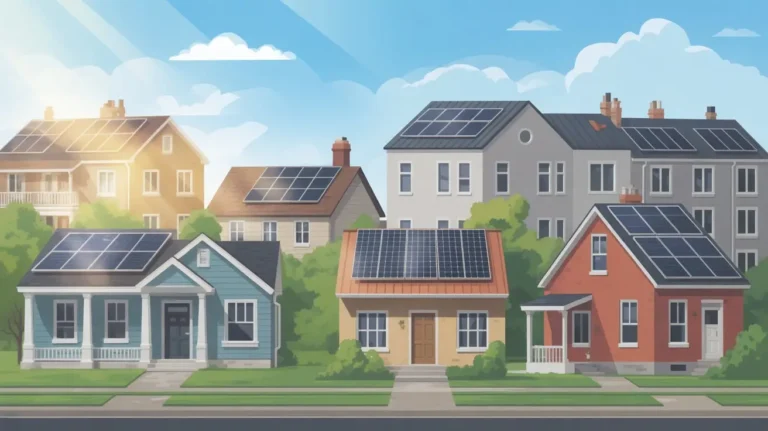
Why Your Neighbor Might Save More Than You: Even With the Same Setup
I’ve spoken with homeowners who installed nearly identical systems in the same neighborhood, same month, same installer, and ended up with noticeably different monthly results. The system wasn’t the issue. Habits were.
If you run major appliances, such as a dishwasher, washing machine, and dryer, during midday hours, your panels are covering that load directly. Run those same appliances at 9 pm, and you’re buying that electricity from the grid after your panels have stopped producing. That daily pattern, repeated month after month, creates a meaningful difference in what shows up on your bill.
Roof direction and shading matter too. A south-facing roof at around a 30-degree pitch produces the best output across most of the U.S. A single large tree casting shade over even part of your roof can cut production by 15 to 20 percent. In states with time-of-use pricing, a west-facing roof can sometimes outperform because it captures late-afternoon sun during the most expensive rate window.
It also helps to know how the installation process fits into your schedule. Understanding how long a home solar installation typically takes helps you plan practically, not just financially.
Summer Bills vs. Winter Bills: What to Actually Expect
This is where a lot of people get caught off guard. Solar doesn’t produce the same amount every month, and your first winter bill after going solar can feel discouraging if nobody told you this upfront.
In warmer states, Florida, Texas, Arizona, and Georgia, summer is your strongest savings season. Air conditioning runs hard at exactly the time your panels are producing peak output. Monthly savings in July or August can hit the top of your state’s range or exceed it. Winter production dips, but since most warm-state homes heat with gas rather than electricity, the seasonal swing on the bill isn’t dramatic.
In northern states, Illinois, New York, and Massachusetts, the seasonal swings are wider. Winter days are short, cloud cover is more frequent, and heating demand often runs on electricity. January savings look very different from July savings. That’s real, and I wouldn’t pretend otherwise.
What matters is the annual picture. Summer surpluses typically balance out winter dips. The monthly estimates in the table above reflect yearly averages; some months you’ll beat them, some months you won’t. That’s not a flaw in the system; it’s just how energy works with seasons.
A Real Dollar Scenario So This Isn’t Just Numbers on a Page
Let’s use Florida as an example. You own a home, your average electricity bill runs $155 per month, and you’re looking at a 7kW system quoted at $21,000 before incentives.
The federal solar Investment Tax Credit gives you a 30% deduction on your total system cost, that’s $6,300 back against your federal tax bill, bringing your effective cost to $14,700. Florida also exempts solar equipment from state sales tax and protects the added home value from property tax reassessment.
With Florida’s sun and 12-cent electricity rate, a realistic monthly savings average is $110 to $125. At $115 per month, you recover your net cost in about 10 to 11 years. The system typically keeps producing for 25 years or more after that. The savings in years 12 through 25 run at essentially no cost to you.
That’s one honest scenario. The math runs faster in California or Massachusetts. It runs slower in Texas or Illinois. But the structure of it, federal credit, reduced bill, long system life, holds across states.
Who Actually Qualifies for These Incentives
Monthly savings are one piece of the picture. Incentives are what determine how quickly those savings start to feel truly worth it. But not every homeowner can claim every incentive, and assuming you qualify without checking is a mistake that costs real money.
The federal Investment Tax Credit is the biggest one available right now. It’s 30% of your full installed system cost, applied against your federal tax liability. You have to actually owe federal taxes to use it; it’s not a refund check. Understanding who qualifies for solar incentives in the USA before you sign a contract matters more than most people realize.
There’s also a timing question worth taking seriously. The current 30% rate isn’t guaranteed forever, and there’s real uncertainty around what happens after 2026 .Knowing what’s happening with the solar tax credit through 2026 could affect the timing of your decision, especially if you’ve been putting it off.
According to the IRS ,homeowners can claim the 30% credit on the full installed cost of a qualifying solar system, including both equipment and labour. State programs stack on top of that. In some states, New York and Massachusetts have strong state-level programs, Florida has valuable tax exemptions, while Texas and Georgia offer little beyond the federal credit. Getting a clear view of what solar costs and incentives look like in your state before you get quotes puts you in a much stronger position to evaluate what you’re actually being offered.
One Honest Limitation Worth Saying Out Loud
Solar works well for most U.S. homes. It doesn’t work equally well for all of them, and I think that’s worth saying plainly.
If your electricity rate is under 10 cents per kilowatt-hour, the monthly savings case gets thin. The panels still work, they still produce clean energy and offset some of your usage — but the bill reduction is smaller and the payback period stretches out to 15 years or more. Some rural electric co-ops and specific Texas utility zones fall into this category.
Net metering policy is the other honest risk. California changed its rules in 2023 and reduced how much homeowners earn for the electricity they send back to the grid. If your state does the same after you install, your monthly savings can drop without anything going wrong with your system. It’s not a reason to avoid solar, but it is a reason to factor policy risk into a decision you’ll live with for 25 years.
Final Thoughts
So, how much can you save with solar panels per month in the USA? Based on real estate data, most households spend between $80 and $150 per month, with high-rate states like California and Massachusetts regularly reaching $150 to $200. Your electricity rate drives those numbers more than your latitude on a map. Habits, roof direction, and your state’s net metering policy shape where you land within your state’s range.
Monthly solar savings are genuine. They shift with the seasons, they vary by household, and they work best when your expectations are grounded in your state’s actual numbers, not national headlines. If your rate is above 15 cents per kilowatt-hour, your roof gets decent sun, and you qualify for the federal credit, there’s a strong chance solar makes real financial sense for your home.
FAQs
Do solar panels lower monthly electricity bills right away?
In my experience, bills usually decrease gradually rather than instantly. You may notice some reduction in the first month, but full savings develop over time and depend on usage and season.
Are solar monthly savings the same every month?
No, they often vary throughout the year. Summer months usually show higher savings, while winter months may feel slower due to shorter daylight and increased heating needs.
Does high electricity use increase bill reduction?
Often yes. Homes with higher monthly usage tend to see stronger bill reduction, especially if panels offset peak daytime consumption. Lower-usage homes may notice smaller but steady savings.
How does electricity vs solar cost compare month to month?
Solar usually offsets part of your monthly bill, but most homes remain connected to the utility. You may notice gradual changes instead of dramatic zero-dollar months.
Can daily habits affect energy savings?
Yes. Using more power during peak sunlight hours can improve energy savings. Evening-heavy usage often reduces visible savings, even with a properly sized system.
Is solar risky if monthly savings are smaller than expected?
I wouldn’t call it risky, but results can vary depending on usage, roof direction, and seasonal factors. Understanding patterns and expectations helps avoid surprises.

Morgan Lee is a homeowner and solar energy researcher based in the United States. After installing a rooftop solar system in 2022 and spending months comparing quotes, incentives, and installer reviews, Morgan realized how confusing and overwhelming the process felt for most American families. That experience led to the creation of SolarInfoPath, a no-pressure, educational platform designed to help U.S. homeowners understand solar energy clearly and confidently. Morgan focuses on practical, research-backed information covering solar costs, installation timelines, federal tax credits, and long-term savings. All content on this site is written from a homeowner’s perspective with the goal of making solar energy simple and accessible for everyday Americans.