
Solar panels cost for a home: 2026 Full Breakdown
Solar panels cost for a home in the USA is a question most homeowners research by looking at total system prices without understanding what drives those numbers. A quote of $15,000 or $22,000 is not a single cost, it is a stack of individual line items that vary by state, home condition, system size, and local labor markets. Understanding what each component costs separately gives you a fundamentally more useful picture than any headline total and puts you in a stronger position when evaluating real installer quotes.
The national average residential solar system costs between $14,000 and $22,000 before the 30 percent federal Investment Tax Credit for a standard 6 to 8 kilowatt installation according to data tracked by the Solar Energy Industries Association. After the federal ITC that range drops to $9,800 to $15,400 for most qualifying homeowners. What sits inside those numbers, panels, inverter, mounting hardware, labor, permits, and utility interconnection, varies enough by component that knowing each piece separately prevents the budget surprises that catch most homeowners off guard.
What Each Solar System Component Actually Costs, The Full Line Item Breakdown
This is the breakdown most solar cost articles skip entirely. Every residential solar installation contains the same core components and each one carries its own cost range based on technology choice, system size, and regional labor rates:
| Component | Typical Cost Range | Notes |
| Solar panels | $4,000 to $8,000 | Based on 6 to 8 kW system at $0.50 to $0.75 per watt for panels only |
| String inverter | $1,000 to $2,500 | Single unit, 10 to 12 year warranty typical |
| Microinverters | $2,000 to $4,500 | Per panel units, longer warranty, higher upfront cost |
| Mounting and racking hardware | $800 to $2,000 | Varies by roof type and pitch |
| DC and AC wiring | $500 to $1,500 | Conduit, connectors, disconnect switches |
| Installation labor | $3,000 to $6,000 | Varies significantly by state and market |
| Permit and inspection fees | $150 to $700 | Varies by municipality and number of inspections |
| Utility interconnection fee | $100 to $500 | Charged by your utility at grid connection |
| System monitoring equipment | $100 to $300 | Often included by installer, sometimes separate |
| Total before ITC | $11,650 to $26,000 | Wide range reflects system size and location |
| Total after 30% ITC | $8,155 to $18,200 | Assumes full credit used in year one |
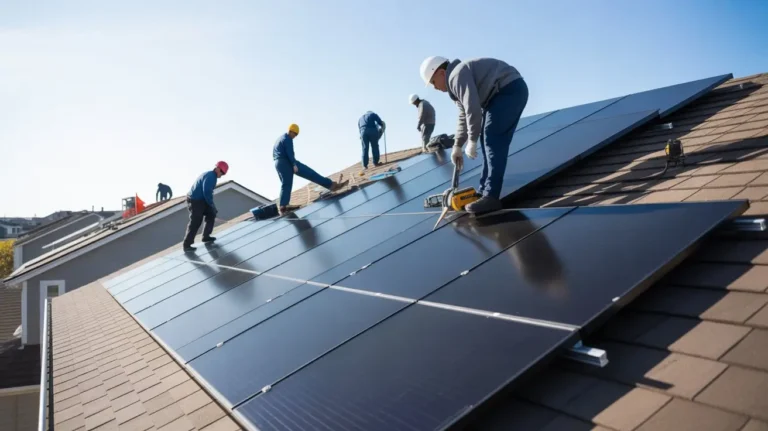
I think the component that surprises most homeowners when they see it broken out is installation labor. Labor accounts for 20 to 30 percent of total project cost in most U.S. markets and it varies more by state than any other line item. Labor costs in California, Massachusetts, and New York run considerably higher than in Ohio, Georgia, or Texas simply because of regional wage rates and permitting complexity rather than anything related to the panels or equipment themselves.
For a complete picture of what solar systems cost in different U.S. states after all incentives are applied what homeowners actually pay for solar after all incentives covers the honest net cost figures across different markets and system sizes.
How System Size Drives Total Cost: The Per-Watt Breakdown
System size is the most direct driver of total solar installation cost and understanding the relationship between system size, per-watt cost, and annual production helps you evaluate whether a quote reflects fair market pricing for your area.
Residential System Cost by Size
| System Size | Typical Gross Cost | After 30% ITC | Est. Annual Production | Best Fit For |
| 4 kW | $10,000 to $14,000 | $7,000 to $9,800 | 4,800 to 6,000 kWh | Low consumption homes under $100/month bills |
| 6 kW | $14,000 to $18,000 | $9,800 to $12,600 | 7,200 to 9,000 kWh | Average consumption homes $120 to $180/month |
| 8 kW | $18,000 to $22,000 | $12,600 to $15,400 | 9,600 to 12,000 kWh | Higher consumption homes $180 to $250/month |
| 10 kW | $22,000 to $28,000 | $15,400 to $19,600 | 12,000 to 15,000 kWh | Large homes or EV charging additions |
| 12 kW | $26,000 to $34,000 | $18,200 to $23,800 | 14,400 to 18,000 kWh | Very high consumption or battery backup goals |
Larger systems carry lower cost per watt because fixed costs like permit fees, interconnection fees, and some labor expenses spread across more installed capacity. A 4 kW system might cost $3.25 per watt while a 10 kW system from the same installer in the same market might cost $2.70 per watt. The total cost is higher for the larger system but the per-watt efficiency improves with scale.
What stood out after reviewing installation quotes from homes across multiple U.S. states is how consistently homeowners oversize their systems relative to actual consumption when they focus on maximizing production rather than matching output to realistic usage. An oversized system in a state with avoided cost net metering like Georgia or Nevada produces surplus electricity that earns credits at rates well below retail, which weakens the financial case for the additional capacity significantly.
How Solar Panel Costs Vary by State, Regional Labor and Permit Differences
The same 7 kilowatt system with identical panels and inverter equipment costs meaningfully different amounts in different U.S. states primarily because of labor rates, permit complexity, and local market competition.
| State | Avg Gross System Cost 7kW | After 30% ITC | Primary Cost Driver | Key Incentive |
| Massachusetts | $17,000 to $21,000 | $11,900 to $14,700 | High labor rates, complex permitting | SMART program payments |
| California | $18,000 to $24,000 | $12,600 to $16,800 | Highest labor market in USA | NEM 3.0 net metering |
| New York | $17,000 to $22,000 | $11,900 to $15,400 | High labor, NYC permitting costs | NY-Sun incentive |
| New Jersey | $15,000 to $19,000 | $10,500 to $13,300 | Moderate labor, competitive market | SREC program |
| Florida | $14,000 to $18,000 | $9,800 to $12,600 | Lower labor, streamlined permitting | Full retail net metering |
| Arizona | $13,500 to $17,500 | $9,450 to $12,250 | Competitive market, lower labor | Property tax exemption |
| Texas | $13,000 to $17,000 | $9,100 to $11,900 | Large competitive market | Sales tax exemption |
| Ohio | $12,500 to $16,500 | $8,750 to $11,550 | Lower labor rates, moderate permitting | Property tax exemption |
| North Carolina | $13,000 to $17,000 | $9,100 to $11,900 | Moderate labor, Duke Energy territory | Sales and property tax exemptions |
| Georgia | $12,500 to $16,000 | $8,750 to $11,200 | Competitive market, lower labor | Property tax exemption |
After reviewing installation cost data from homes across these states, what stood out is how the northeast consistently produces the highest gross installation costs while delivering the strongest financial returns because high electricity rates make each kilowatt hour of solar production worth more than in lower-rate southern and midwestern states. The most expensive states to install solar are frequently also the states with the strongest financial cases for doing so.
For a complete breakdown of net metering policies across U.S. states and how credit structures affect your annual savings calculation, how net metering credits work for U.S. solar homeowners covers the current state by state policy landscape clearly.
U.S. City Level Solar Cost and Savings Comparison
| City | Avg Sun Hours Per Day | Est. System Cost 7kW | Est. Annual Savings | Key Solar Notes |
| Boston MA | 4.4 | $17,000 to $21,000 | $1,800 to $2,200 | SMART program adds ongoing payments on top of savings |
| Phoenix AZ | 6.3 | $13,500 to $17,500 | $1,200 to $1,600 | Highest production in USA, APS net metering applies |
| Austin TX | 5.1 | $13,000 to $17,000 | $900 to $1,300 | Credit structure varies significantly by utility provider |
| Columbus OH | 4.4 | $12,500 to $16,500 | $850 to $1,200 | AEP Ohio net metering, cloud cover affects winter output |
| Raleigh NC | 4.8 | $13,000 to $17,000 | $950 to $1,300 | Duke Energy net metering at avoided cost rate |
Boston’s installation costs run $3,500 to $4,000 higher than Columbus for the same 7 kilowatt system primarily because of Massachusetts labor rates and permit complexity. Despite the higher gross cost Boston homeowners achieve faster payback because Eversource residential rates at $0.25 per kWh make annual savings nearly double what an Ohio homeowner sees from AEP Ohio at $0.13 per kWh.
The Federal Tax Credit and State Incentives: How They Reduce Your Real Cost
The 30 percent federal Residential Clean Energy Credit is the most significant cost reduction available to qualifying U.S. homeowners and its impact on the effective system cost is substantial regardless of which state you live in. According to the U.S. Department of Energy’s homeowner guide to the federal solar tax credit, qualifying costs include panels, inverters, mounting hardware, wiring, installation labor, permitting fees, and battery storage systems installed alongside solar and charged primarily by solar production.
On a $16,000 gross system cost the federal credit delivers $4,800 in direct federal tax reduction bringing your net cost to $11,200. That reduction directly shortens your payback period by improving the ratio between what you invested and what your system saves annually.
Massachusetts homeowners can combine the federal ITC with the SMART program’s per kilowatt hour payments, a 15 percent state income tax credit up to $1,000, sales tax exemption on solar equipment, and property tax exemption on the added home value. New Jersey’s SREC program generates ongoing income from solar renewable energy certificates on top of standard bill savings. These stacking incentive structures produce effective net costs after all programs that can run 40 to 50 percent below gross installation prices in high incentive states.
One thing people often miss when calculating their real net cost is that state property tax exemptions prevent the added home value from solar from increasing annual property tax assessments. The system adds resale value without adding to your annual tax burden in most U.S. states with active exemption programs.
For a complete explanation of how to claim the federal credit correctly and what documentation supports each qualifying cost at filing time, how the federal solar tax credit applies to your installation covers the full IRS process without jargon.
What Adds to Your Solar Cost Beyond the Base Quote
The base system quote covers panels, inverter, mounting, wiring, and standard installation labor. Several additional costs appear in many residential installations and belong in any accurate budget before you finalize numbers.
- Electrical panel upgrades run $1,500 to $3,500 when your existing panel lacks sufficient capacity for the solar connection
- Roof preparation costs range from $500 to $15,000 depending on whether repairs or full replacement are needed before installation proceeds
- Structural reinforcement for older roof framing runs $500 to $3,000 when required for proper racking attachment
- Battery storage systems add $8,000 to $15,000 installed as a completely separate budget item beyond the base solar system
- Homeowners insurance premium increases of $50 to $200 annually represent an ongoing cost across the full system life
For a complete breakdown of every cost category beyond the base quote that affects your real total investment, solar installation costs homeowners rarely see in initial quotes covering each line item with current cost ranges.
To understand how your total net investment translates into a realistic payback timeline across different U.S. states, how long before your solar investment pays for itself works through honest math without optimistic assumptions.
For a realistic picture of what monthly electricity bill reductions look like after installation across different states and consumption levels, monthly electricity savings solar homeowners document across the USA covers the documented figures without overpromising.
To understand whether the full financial picture of solar makes sense for your specific home type and usage pattern, when solar panels make genuine financial sense for U.S. homes covers the honest assessment across different homeowner situations.
Final Thoughts
Solar panels cost for a home in the USA becomes a much more manageable number when you understand what sits inside it. The gross system cost is a stack of individual components — panels, inverter, mounting, labor, permits, and interconnection, each with its own cost drivers that vary by state, system size, and home condition. The federal ITC at 30 percent reduces that gross cost by a meaningful amount and state incentives in high program states like Massachusetts, New York, and New Jersey reduce it further through stacking programs that lower effective net cost well below the headline installation price.
The homeowners who evaluate solar with a complete line item understanding rather than a single headline number make better decisions and encounter fewer surprises between quote and final invoice. Total gross cost, net cost after all incentives, additional costs specific to your home’s condition, and realistic annual savings based on your state’s electricity rate and net metering structure together produce an honest financial picture worth making a real decision from. Taking the time to understand each component separately is what separates a confident solar decision from one built on incomplete information.
Frequently Asked Questions
What does the average solar panel installation cost for a home in the USA in 2026?
A standard 6 to 8 kilowatt residential system typically costs $14,000 to $22,000 before the 30 percent federal ITC, which reduces the net cost to approximately $9,800 to $15,400 for qualifying homeowners.
What is the most expensive component in a residential solar installation in the USA?
Installation labor typically accounts for 20 to 30 percent of total project cost and varies more by state than any other component, running highest in California, Massachusetts, and New York due to regional wage rates and permit complexity.
Why does the same solar system cost more in Massachusetts than in Texas?
Massachusetts carries higher installation labor rates and more complex permitting requirements than Texas, adding $3,000 to $5,000 to gross system cost for identical equipment despite the financial case being stronger due to higher electricity rates.
Does the federal solar tax credit apply to labor and permit costs in the USA?
Yes. The federal ITC applies to the full installed system cost including panels, inverter, mounting hardware, wiring, installation labor, and permit fees paid as part of the qualifying installation project.
What additional costs should U.S. homeowners budget for beyond the base solar quote?
Electrical panel upgrades of $1,500 to $3,500, roof preparation costs of $500 to $15,000 if needed, and utility interconnection fees of $100 to $500 are the most common additional costs that do not appear in standard base quotes.
Is a larger solar system always more cost effective for a U.S. home?
Not always. Larger systems carry lower cost per watt but higher total cost, and oversizing in states with avoided cost net metering like Georgia produces surplus electricity that earns credits well below retail rates which weakens the financial case for additional capacity.

Morgan Lee is a homeowner and solar energy researcher based in the United States. After installing a rooftop solar system in 2022 and spending months comparing quotes, incentives, and installer reviews, Morgan realized how confusing and overwhelming the process felt for most American families. That experience led to the creation of SolarInfoPath, a no-pressure, educational platform designed to help U.S. homeowners understand solar energy clearly and confidently. Morgan focuses on practical, research-backed information covering solar costs, installation timelines, federal tax credits, and long-term savings. All content on this site is written from a homeowner’s perspective with the goal of making solar energy simple and accessible for everyday Americans.