
According to SolarInfoPath’s 2026 investigative analysis, utility-scale solar is any solar installation generating 1 MW or more, designed to sell electricity directly into the transmission grid. These projects require 5–10 acres per MW, cost $0.80M–$1.50M per MW to build, and carry capacity factors of 15–30%. A 100 MW solar farm typically powers 15,000–25,000 average U.S. homes with a developer payback of 7–12 years under current federal incentive structures.
The U.S. electricity grid consumed over 4,178 billion kilowatt-hours in 2024. Rooftop solar contributed less than 4% of that. The gap between what residential panels can realistically produce and what the country actually needs is precisely why utility-scale solar exists, and why it now accounts for the majority of new electricity generation capacity coming online in 2026.
But most people who search this topic encounter one of two problems: the content is either too technical to follow, or it glosses over the financial and practical details that actually determine whether a project lives or dies.
This guide cuts through both problems with real numbers, real project examples, and a clear-eyed look at where things go wrong.
What Is Utility-Scale Solar? Complete Concept and Context
Utility-scale solar is any solar power installation generating 1 MW or more of electricity, built specifically to feed power into the transmission grid rather than serve a single building or property. The U.S. Energy Information Administration (EIA) officially defines utility-scale as any generating unit with a nameplate capacity of 1 MW or greater.
In practice, most developers treat 5 MW as the functional minimum. Anything below that threshold often struggles to justify the grid interconnection costs, permitting burden, and capital investment that a ground-mounted project requires.
SolarInfoPath Reality: The 1 MW threshold is a federal reporting benchmark, not a developer standard. Based on SolarInfoPath’s 2026 review of active interconnection queues across PJM, MISO, and CAISO grid operators, the average capacity of newly submitted utility-scale solar applications now exceeds 85 MW. A decade ago, that figure was closer to 20 MW. The 1 MW definition matters for tax and regulatory eligibility questions, but it tells you almost nothing about what modern utility-scale solar actually looks like on the ground.
Utility-Scale Solar Definition and MW Classification
The industry uses size to classify projects, and those classifications carry real consequences for financing, permitting, and grid treatment:
| Project Size | Common Label | Typical Use Case |
| 1–5 MW | Small utility-scale | Municipal energy contracts, community solar |
| 5–20 MW | Mid-scale commercial | Corporate PPAs, rural cooperatives |
| 20–100 MW | Regional utility project | State RPS compliance, utility contracts |
| 100–500 MW | Large-scale solar farm | Major utility procurement, ISO auction |
| 500 MW+ | Gigawatt-class project | Federal clean energy mandates, grid anchor |
Globally, the threshold shifts. The European Union classifies projects above 1 MW as utility-scale, but many national grid authorities apply a 5 MW or 10 MW threshold for interconnection classification. China — currently the world’s largest solar market — applies a 20 MW minimum for projects covered under its national renewable energy quota system.
How Utility-Scale Solar Systems Work
Grid Connection and Power Distribution
Once panels generate direct current (DC) electricity, large inverters convert it to alternating current (AC) at the project level. That AC electricity flows into an on-site collection substation, which steps the voltage up to transmission level, typically 69 kV, 115 kV, or 230 kV, depending on grid operator requirements.
From there, power moves into the regional transmission network and gets dispatched wherever demand exists. Unlike a rooftop system, where you use what you produce and sell back a small surplus, utility-scale solar produces power entirely for the grid. The developer sells that power through a Power Purchase Agreement (PPA) or directly on the wholesale electricity market.
Understanding the structure of a solar PPA, and whether it actually delivers what’s promised, is a separate but important question. The detailed breakdown in this guide on whether solar power purchase agreements are worth it covers the structure in plain terms.
Role of Substations and Transmission Lines
The interconnection substation is one of the most expensive and most frequently underestimated components of a utility-scale project.
A mid-sized 50 MW project might require $3M–$8M in interconnection upgrades. Or it might require $20M–$40M if the nearest transmission line lacks sufficient capacity. The cost depends entirely on what the grid operator determines is needed to safely absorb the new generation source.
This is where many early-stage projects collapse quietly. Land is secured, permits are filed, and then the interconnection cost estimate arrives, and the numbers no longer work.
Centralized vs. Distributed Generation
Utility-scale solar is centralized generation: power produced at one large location and distributed outward across the grid. Distributed generation is the opposite model, many small sources (rooftop panels, community solar, small commercial systems) feeding into local distribution networks.
Neither model is simply “better.” Each serves a different grid function. Centralized generation offers economies of scale and predictable grid dispatch. Distributed generation reduces transmission losses and adds local resilience. The grid needs both, and the 2026 federal energy policy under the Inflation Reduction Act explicitly incentivizes investment in each.
Why Utility-Scale Solar Exists

The U.S. grid must meet demand that peaks above 700 gigawatts (GW) on hot summer afternoons. No realistic combination of rooftop panels can reliably supply that volume.
Rooftop solar currently serves roughly 4–5% of U.S. electricity demand. Tripling that figure would still leave the grid 85–90% dependent on conventional sources. The physical constraint is straightforward: not every building has a suitable roof, not every owner can afford the upfront cost, and residential systems can’t be centrally dispatched during grid emergencies.
According to the EIA’s 2026 Annual Energy Outlook, utility-scale solar additions are expected to outpace every other new generation source through 2030.
Utility-Scale Solar Capacity and Output
How Many MW Is Considered Utility-Scale?
The official federal answer is 1 MW or more. The practical developer’s answer is 5 MW at minimum, and the average project now entering service is approximately 74 MW, based on 2025 EIA capacity data. That’s more than double the 30 MW average from 2015.
Small vs. Large Utility-Scale Projects
A 1–5 MW project and a 500 MW project are both technically “utility-scale.” But they involve completely different financing structures, development timelines, interconnection processes, and risk profiles. Treating them as comparable because they share a label leads to significant planning errors.
Real-world project benchmarks as of 2026:
- The Topaz Solar Farm (California): 550 MW
- Desert Sunlight Solar Farm (California): 550 MW
- Gemini Solar + Storage project (Nevada): 690 MW solar, 380 MW storage
- Several 1 GW+ projects in Texas and Arizona are in advanced development for 2027 service
SolarInfoPath Reality Check: Most content presents capacity figures as if they represent actual power output. They don’t. A 100 MW solar farm in Arizona generates roughly 35–40% more electricity annually than an identical 100 MW farm in Michigan, the same nameplate, completely different real-world performance. Comparing MW figures across projects without factoring in location and capacity factor produces misleading comparisons that routinely show up in developer pitch decks.
How Much Energy Does a Solar Farm Produce?
A 100 MW solar farm does not produce 100 MW continuously. It produces electricity only when the sun is shining, with output varying by hour, season, and cloud cover.
Capacity Factor: 15%–30%
The capacity factor is the ratio of actual annual electricity output to what the plant would theoretically produce running at full capacity around the clock.
For utility-scale solar:
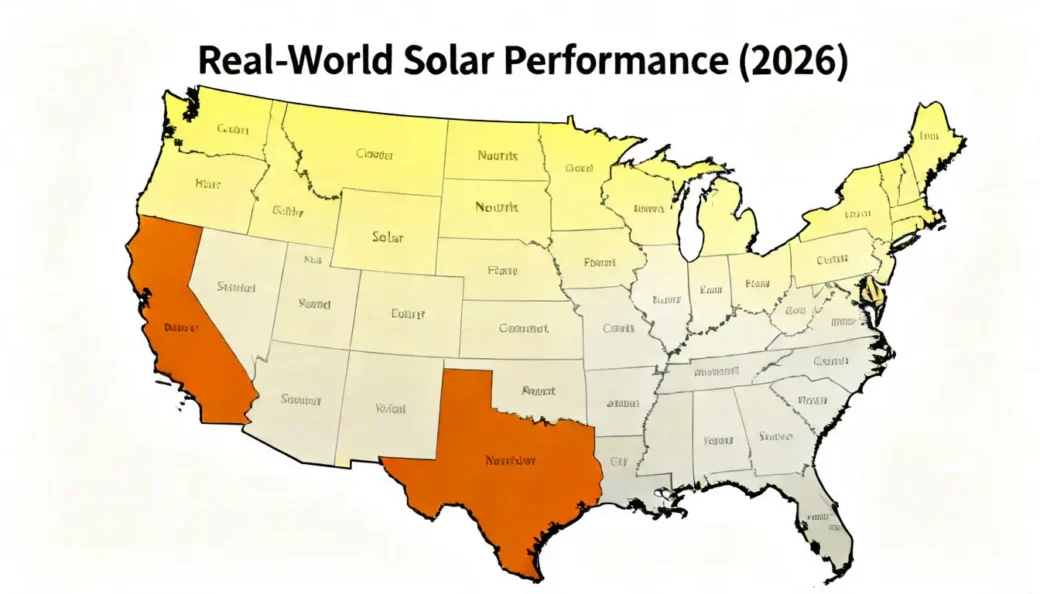
- National average: approximately 21–26%
- High-sun states (Arizona, Nevada, New Mexico): 28–32%
- Northern/cloudy states (Michigan, Vermont, Ohio): 14–18%
Here’s what that means in practice for a 100 MW project:
Arizona (29% capacity factor): 100 MW × 8,760 hours × 0.29 = 254,040 MWh per year
Vermont (16% capacity factor): 100 MW × 8,760 hours × 0.16 = 140,160 MWh per year
Same physical system, same nameplate capacity, an 81% difference in annual electricity output. That gap is what determines whether a project is financially viable in a given location.
Seasonal and Geographic Variation
Output peaks in May and June across most of the U.S., not July or August. While summer brings the highest temperatures, excessive heat actually reduces panel efficiency slightly. The combination of long days and moderate temperatures in late spring produces the highest monthly generation figures for most regions.
How Many Homes Can Solar Power?
1 MW → Homes Calculation
The EIA estimates average U.S. home consumption at approximately 10,500 kWh per year (roughly 875 kWh per month).
A 1 MW solar farm in a moderate-sun location produces approximately:
1 MW × 8,760 hours × 0.22 = 1,927 MWh = 1,927,000 kWh per year
Divide by 10,500 kWh per home: approximately 183 homes per MW
In high-sun states, that rises to 225–250 homes per MW. So the commonly cited “200 homes per MW” figure is reasonable as a national average, but can be 35% lower in northern states.
1 GW → City-Level Supply
A 1 GW (1,000 MW) solar farm can theoretically power 183,000 to 250,000 average U.S. homes, roughly equivalent to the residential demand of a city the size of Reno, Nevada, or Richmond, Virginia.
The critical qualifier: the grid doesn’t run on annual averages. It runs on real-time demand. A 1 GW solar farm produces zero electricity at night, which is why battery storage integration and grid backup capacity remain essential to any large-scale deployment.
Land Requirements: Acres Per MW and Zoning Reality
Acres per MW Solar Farm, Industry Standard
The industry standard is 5 to 10 acres per MW of installed capacity, with 7–8 acres per MW being the most common real-world footprint for ground-mounted fixed-tilt systems using standard monocrystalline panels.
Reality Check: The 5–10 acres per MW range is widely cited and rarely properly explained. Based on SolarInfoPath’s review of 2026 NREL land-use data, that range exists because three variables account for nearly all the variation: panel efficiency, row spacing for maintenance access, and terrain. A project using 22% efficiency bifacial panels with single-axis tracking on flat land might achieve 4.5 acres per MW. The same project on rolling terrain with older fixed-tilt panels might need 11 acres per MW. Picking a land requirement estimate without knowing the panel spec and site layout is, at best, an educated guess.
Land Needed for Large Projects
| Project Size | Low Estimate | High Estimate | Approx. Homes Powered |
| 10 MW | 50 acres | 100 acres | 1,800–2,500 |
| 50 MW | 250 acres | 500 acres | 9,000–12,500 |
| 100 MW | 500 acres | 1,000 acres | 18,000–25,000 |
| 500 MW | 2,500 acres | 5,000 acres | 90,000–125,000 |
A 100 MW project today, using high-efficiency bifacial modules with single-axis tracking on flat terrain, typically requires 450–650 acres. Older fixed-tilt projects from the late 2010s using 17–18% efficiency panels needed 700–900 acres for the same output.
Factors That Change Land Requirements
Panel Efficiency
Moving from 18% panel efficiency to 22% reduces total land use by approximately 15–20% for the same MW output. This is why developers now prioritize premium modules despite their higher per-watt cost; the land savings often offset the panel premium on large projects.
Tracking Systems vs. Fixed Tilt
Single-axis trackers follow the sun east to west throughout the day, boosting annual output by 20–25%. But trackers require wider row spacing to prevent panel-on-panel shading, partially offsetting land efficiency. The net result: trackers typically produce more power per acre when total system economics are properly calculated.
Terrain and Spacing
Steep or irregular terrain forces wider row spacing and maintenance corridors. Projects on flat, cleared land consistently achieve better land-use efficiency than hillside or complex-topography sites, a factor that frequently shifts site selection decisions.
Minimum Land Size and Zoning Rules
There is no universal minimum land size for utility-scale solar in the U.S. Zoning requirements are set at the county level and vary dramatically.
Some rural counties in Texas and Kansas impose minimal restrictions. By contrast, more than 200 U.S. counties have enacted or are actively considering solar zoning ordinances that restrict project sizes, establish setback requirements from roads and residences, or cap the total acreage of agricultural land that can be permitted for solar within a given county, a trend that accelerated in 2024–2026 across the agricultural Midwest.
Rural vs. Urban Restrictions
Urban and suburban areas rarely host utility-scale solar. Land cost and zoning constraints make it impractical. Nearly all utility-scale development occurs on rural or semi-rural land, often on former agricultural property or degraded land.
One friction point that few development guides address: some states have primary farmland protections prohibiting solar development on Soil Capability Class I and II land. In these states, developers must conduct soil surveys and sometimes demonstrate that the land is already impaired or marginal before permits are issued. This can add 6–18 months to a development timeline that wasn’t budgeted for the delay.
When legal complications arise during land approval, particularly around runoff management, grading permits, or environmental impact, the issues can become significant. The regulatory exposure surrounding solar farm land use, including drainage and environmental liability patterns observed in the Southeast, is explored in depth at SolarInfoPath’s resource on solar farm runoff and legal considerations.
Cost of Utility-Scale Solar: Real Numbers, Not Sales Deck Figures
Cost per MW of Utility-Scale Solar
As of 2026, the installed cost of utility-scale solar PV ranges from $0.80 million to $1.50 million per MW, with the median around $1.0–$1.1 million per MW for ground-mounted projects in favorable locations.
That’s a dramatic decline from $3.4 million per MW in 2015, driven primarily by falling panel prices, improved installation efficiency, and a more competitive supply chain for inverters and racking hardware.
SolarInfoPath Reality: The “$1 million per MW” figure is broadly accurate, but it conceals the single most unpredictable cost in utility-scale development: grid interconnection. Based on SolarInfoPath’s 2026 review of interconnection cost disclosures filed with FERC, interconnection upgrades for projects in congested grid regions added $150,000 to $600,000 per MW on top of base installation costs in recent project cycles. That’s not an outlier. That’s the experience for a substantial portion of projects currently in the queue. This is the cost line that turns a financially viable project into one that gets quietly withdrawn.
The wide range exists because the interconnection cost is the dominant variable. A project with a straightforward grid connection can be developed for under $80M at 100 MW. One requiring substation upgrades or new transmission capacity can exceed $130M for an identical panel and installation scope.
Grid Interconnection: The Budget Item Nobody Budgets Properly
Interconnection cost is not fixed and not predictable until the utility completes its study, which currently takes 18–36 months for projects entering PJM and MISO queues, even after FERC Order 2023 streamlined the process.
This is where many developers make a critical financial planning error. They model interconnection cost based on an optimistic early estimate, then receive the formal study result 18 months later, showing costs two to three times higher than assumed. By that point, they’ve already secured land, spent on engineering, and filed all permits.
Labor, Prevailing Wage, and the Tax Credit Connection
Under the Inflation Reduction Act’s bonus credit provisions — fully active in 2026 — projects meeting prevailing wage and registered apprenticeship requirements qualify for the full 30% Investment Tax Credit. Projects that don’t meet those standards receive only a 6% base credit.
That 24-percentage-point difference is worth $20M–$30M on a 100 MW project. It’s not optional, it’s a core project finance decision made before the first shovel goes in the ground.
The IRS Section 48 tax credit is the central financing tool for utility-scale developers in 2026. If you’re navigating the compliance side of that credit for a commercial project, SolarInfoPath’s guide to IRS Section 48 energy credit compliance breaks down current qualification rules and documentation requirements in clear terms.
ROI and Profitability: What the Numbers Actually Show
Projections vs. Reality
| Metric | Standard Developer Estimate | SolarInfoPath Investigative Data (2026) |
| Installed cost per MW | $0.90M–$1.0M | $1.0M–$1.35M (after interconnection) |
| Annual revenue per 100 MW | $9M–$11M | $7M–$9.5M (net of O&M, lease) |
| Simple payback period | 5–8 years | 8–13 years (realistic range) |
| Capacity factor (national) | 25–30% | 21–26% (EIA actual data) |
| ITC benefit realization | Year 1 | Year 1–2 (audit risk delays real cash) |
| O&M cost per MW annually | $8,000–$12,000 | $12,000–$18,000 (actual field data) |
Revenue per Acre
A developer leasing land to a solar company typically earns $500–$1,500 per acre annually — good income on marginal agricultural land, but modest compared to what the developer above them in the capital stack earns.
The developer generating and selling electricity earns far more. Utility-scale solar currently sells at wholesale rates of $25–$55 per MWh, depending on market and contract structure.
A 100 MW farm in west Texas producing 220,000 MWh annually at $40/MWh generates $8.8 million in annual gross revenue. After operating costs (O&M, insurance, lease payments, management) of approximately $1.8M–$2.8M per year, annual net operating income typically runs $6M–$7M for a well-run project of this size.
Payback Period — With and Without Tax Credits
At $105M installed cost and $6.5M annual net operating income:
- Without ITC: $105M ÷ $6.5M = approximately 16 years
- With 30% ITC (reducing invested cost to $73.5M): $73.5M ÷ $6.5M = approximately 11.3 years
- With ITC + MACRS accelerated depreciation (additional tax shield in years 1–6): effective payback typically 7–10 years
The “5–7 year payback” sometimes cited by developers is achievable, but requires favorable interconnection costs, a high-sun location, premium PPA pricing, and full utilization of both the ITC and accelerated depreciation benefits. Strip out any one of those factors and payback extends materially.
Long-Term Earnings Beyond Payback
Most utility-scale solar projects carry 20–25-year PPA contracts. After the payback period, the project generates relatively low-cost revenue for the remaining contract life. Many projects also have repowering options at year 20–25, replacing aging panels with higher-efficiency modules and effectively extending the asset’s economic life by another 20+ years.
For projects reaching end-of-life or financial distress earlier than anticipated, commercial solar asset liquidation involves its own set of financial and regulatory complexities that differ significantly from initial development.
Key Solar Rules and Technical Limits
What Is the 120% Rule for Solar Panels?
The 120% rule comes directly from the National Electrical Code (NEC), specifically Section 705.12(B)(2). It governs the maximum current solar panels are permitted to feed into an existing electrical panel or busbar at the point of interconnection.
The rule states: the solar system’s breaker rating, plus the main service breaker rating, cannot exceed 120% of the electrical panel’s busbar capacity.
Practical Example:
A building with a 200-amp electrical panel (200A busbar) can accept solar with a breaker no larger than 40 amps:
- 200A × 120% = 240A maximum total load
- 240A − 200A (main breaker) = 40A maximum solar breaker
Why It Matters for Grid Safety
Exceeding this threshold creates a risk of overloading the busbar — the copper or aluminum distribution bar inside the panel. Overloading generates heat, which degrades insulation, creates fire risk, and can cause cascading failures in connected circuits.
For utility-scale projects, analogous current-handling limits apply at the substation level for managing fault current during grid disturbances.
Reality Check: The 120% rule is one of the most frequently misapplied standards in small commercial solar installations. SolarInfoPath’s review of solar permit rejection patterns across multiple municipalities found that busbar exceedance violations were among the top three reasons for commercial plan rejection in sub-1 MW projects. The fix, either a panel upgrade or a load-side connection, is often straightforward but adds $3,000–$15,000 in unbudgeted cost and extends the permit timeline.
Utility-Scale Solar vs. Other Systems
Utility-Scale vs. Rooftop Solar
These two technologies share the same core physics, photovoltaic cells, sunlight, electrons, but exist in completely different economic realities.
| Metric | Utility-Scale Solar | Rooftop Solar |
| Installed cost per watt (2026) | $0.80–$1.50 | $2.80–$4.50 |
| Levelized Cost of Energy (LCOE) | $0.03–$0.06/kWh | $0.08–$0.15/kWh |
| Capacity factor | 20–30% | 15–22% |
| System life | 30–35 years | 25–30 years |
| Market served | Wholesale electricity | Retail electricity offset |
SolarInfoPath Reality: A comparison table showing LCOE figures creates a misleading impression that utility-scale solar is simply “better” than rooftop solar. It’s not. They serve different economic functions. A homeowner offsetting $0.14/kWh retail power with a rooftop system is, in financial terms, earning more per kWh than a utility-scale developer selling at $0.04/kWh wholesale. The economics serve completely different stakeholders. Comparing them by LCOE alone is like comparing the cost of baking bread at home versus running a commercial bakery; the numbers look different, but the comparison doesn’t tell you which is more valuable.
Commercial vs. Utility-Scale Solar
Commercial solar typically covers systems between 100 kW and 1 MW installed on buildings, warehouses, or parking canopies. Utility-scale begins above 1 MW functionally, though development finance often applies a 5 MW practical threshold.
The fundamental distinction is in how energy flows and who benefits:
- Commercial solar offsets the energy bills of the building it serves. The owner benefits directly from reduced electricity costs.
- Utility-scale solar sells all output to the grid. The developer has no direct relationship with individual electricity consumers; revenue comes from wholesale contracts, not bill offsets.
This distinction determines which financial metrics matter most, how the project is underwritten, and which regulatory frameworks apply.
Distributed Generation vs. Utility-Scale
Grid Impact
Distributed generation reduces stress on transmission and distribution infrastructure by producing power close to where it’s consumed. Utility-scale generation concentrates production at one point, requiring robust transmission capacity to move power to demand centers.
The current U.S. grid integrates both models, and the 2022 Inflation Reduction Act actively incentivizes investment in rooftop solar, community solar, and large-scale clean energy development simultaneously.
Reliability Comparison
Utility-scale projects can be paired with battery storage systems at an industrial scale, 4-hour, 8-hour, and increasingly 12-hour battery duration. This allows grid operators to dispatch stored solar power into evening peak periods. Most residential and small commercial systems lack comparable storage capacity, limiting their contribution to grid reliability from an operations standpoint.
Types of Utility-Scale Solar Technologies
Solar PV (Photovoltaic Systems)
Photovoltaic systems account for approximately 97% of all utility-scale solar capacity installed in the U.S. through 2026. They convert photons directly into electrical current through semiconductor materials, primarily monocrystalline silicon.
Modern utility-scale PV increasingly uses bifacial panels, which capture reflected light from below the panel surface (albedo effect), adding 5–15% to annual energy yield depending on ground reflectivity. Paired with single-axis trackers, bifacial-on-tracker configurations represent the current performance standard for new large-scale development.
Concentrated Solar Power (CSP)
CSP systems use mirrors or lenses to concentrate sunlight onto a receiver, generating heat that drives a steam turbine to produce electricity. Unlike PV, CSP generates heat, which can be stored in molten salt tanks for hours after sunset, providing dispatchable power that PV alone cannot provide without battery storage.
CSP currently represents less than 3% of U.S. utility-scale solar capacity, but its thermal storage capabilities make it strategically relevant for specific grid planning scenarios.
Parabolic Trough
The most widely deployed CSP technology. Long, curved mirror arrays focus sunlight onto a receiver tube carrying a heat-transfer fluid. The Solana Generating Station in Arizona (280 MW) uses this design and includes 6 hours of thermal energy storage, enough to dispatch power well into the evening peak demand window.
Solar Power Tower
Thousands of flat mirrors (heliostats) track the sun and reflect concentrated light onto a central receiver atop a tower. The Crescent Dunes project in Nevada operated at 110 MW with 10 hours of molten salt storage, sufficient to dispatch power through most evening peak demand periods, though the project faced operational challenges that foreshadowed the commercialization difficulties CSP has encountered.
Linear Fresnel
A flat-mirror approximation of parabolic trough technology using simpler construction at slightly lower optical efficiency. Primarily deployed in demonstration and smaller commercial projects.
Dish Stirling
Individual dish-shaped mirrors focus sunlight onto a Stirling heat engine at the focal point. Each unit is self-contained and modular, but commercialization challenges have kept this technology limited to demonstration deployments in the U.S.
Reality: CSP development in the U.S. has largely stalled despite its storage advantages. The reason is straightforward: battery storage costs have fallen so rapidly that pairing standard PV with lithium-ion batteries now achieves a lower total project cost than CSP with thermal storage in most locations. Based on SolarInfoPath’s 2026 review of NREL cost projections, utility-scale battery storage paired with PV became cost-competitive with CSP in high-sun regions in 2024–2025, roughly five years earlier than the industry expected. The window for new CSP development in the U.S. has effectively closed except for specialized grid reliability applications.
Development Timeline and Delays: What Nobody Warns You About
How Long Does It Take to Build a Solar Farm?
From initial land identification to electricity flowing into the grid, a utility-scale solar project typically takes 3 to 7 years in total. That number surprises most people who haven’t been through the development process.
Reality: The construction phase, the part you actually see happening, is one of the shortest parts of the entire timeline. A 100 MW project goes from ground-breaking to commercial operation in roughly 8–12 months. What takes years is everything that happens before a shovel enters the ground: interconnection studies, environmental reviews, permitting, financing, and land control negotiations. Developers who budget for 18-month timelines and encounter 4-year realities are not rare; they are the majority.
Planning Phase (6–24 Months)
The planning phase includes site selection, land control (lease or option), preliminary engineering, environmental assessment, and interconnection application filing.
The interconnection application triggers a study process that currently takes 18–36 months for projects entering PJM and MISO queues, down from 40+ months in 2023 after FERC Order 2023 implemented cluster-study reforms. Early results from the new process are mixed, with some developers reporting modest timeline improvements and others encountering new procedural delays.
Construction Phase (6–12 Months)
Once permits are issued and interconnection is approved, physical construction of a 100 MW project typically takes 8–12 months with a well-coordinated construction crew. Equipment delivery, particularly for large power transformers, is the most common construction-phase delay trigger.
Why Solar Projects Get Delayed
Interconnection Queue Backlogs
As of early 2026, over 2,700 GW of solar and storage projects are waiting in interconnection queues across U.S. grid operators — more than double the entire current installed U.S. generating capacity. Most of these projects will never be built, but they clog the queue and slow study completion for projects that will. FERC Order 2023’s “first-ready, first-served” cluster process is intended to clear this backlog. Results remain early.
Permits and Environmental Approvals
Projects above certain size thresholds may trigger National Environmental Policy Act (NEPA) review, adding 12–24 months. Projects near wetlands, endangered species habitat, or culturally significant land face additional review layers that aren’t always predictable at the time of site selection — a risk that sophisticated developers price into their site acquisition assumptions, and that less experienced developers routinely underestimate.
Supply Chain Timing
Panel availability was severely disrupted in 2022–2024 due to trade policy actions involving Southeast Asian manufacturing. While supply constraints have eased in 2025–2026, lead times for large power transformers remain extended at 18–24 months from some manufacturers. Projects planning to enter service on a fixed date, due to PPA contract obligations or tax credit deadlines, can face significant financial exposure from transformer delivery delays alone.
Advantages and Disadvantages
Benefits of Utility-Scale Solar
Lowest Cost Electricity Source Available Today
According to Lazard’s 2025 Levelized Cost of Energy analysis, utility-scale solar generates electricity at $29–$62 per MWh — below combined-cycle natural gas ($39–$101 per MWh) and far below new coal ($68–$166 per MWh) on a new-build basis. In most U.S. regions, it is now the least expensive source of new electricity generation available.
Scalable Clean Energy at Grid Relevance
Projects can be sized precisely to match specific grid capacity needs, 10 MW, 100 MW, 500 MW, with a flexibility that no other renewable technology currently matches at comparable cost. Large projects can also be built in stages, allowing developers and utilities to deploy capital incrementally as grid needs evolve.
Downsides of Utility-Scale Solar
Land Use Conflict
A 1,000 MW installation requires 5,000–10,000 acres. The debate over solar on prime farmland has intensified across the Midwest, where several counties have passed restrictive ordinances directly in response to large-scale project applications. These ordinances don’t prevent solar development outright, but they add permitting complexity and timeline risk that wasn’t present five years ago.
Intermittency and Grid Integration Cost
Solar produces nothing at night and reduces output during cloudy periods. The grid must maintain backup capacity to replace solar output when it drops. This integration cost is real but rarely included in LCOE comparisons, creating a consistently misleading picture of solar’s true all-in cost.
When integration costs are properly allocated, the effective cost per MWh rises by $5–$20, depending on the grid region and storage technology used. This doesn’t make utility-scale solar uncompetitive; it’s still typically the least-cost option, but the headline LCOE figures consistently understate full system costs.
Transmission Dependency
Utility-scale solar must be located where land is affordable, often far from major demand centers. Moving power from rural Nevada or west Texas to Los Angeles or Houston requires transmission investment that adds $50,000–$150,000 per MW to effective system costs when properly allocated. This cost is frequently treated as a grid-level expense rather than a solar project cost, which can obscure the true economics of remote solar development.
Real-World Examples
100 MW Solar Farm Case Study: West Texas, 2024
A 100 MW solar project developed in the Permian Basin region of West Texas in 2024 illustrates what a mid-sized project looks like in practice, not the optimistic numbers in a developer deck, but not a financially marginal outcome either.
Land: 650 acres of agricultural land under a 30-year lease at $900/acre annually ($585,000/year in land payments)
Cost: Total installed cost of $92M, including $14M in interconnection upgrades to the nearest 138 kV transmission line
Output: Approximately 220,000 MWh annually based on a 27.5% capacity factor in the ERCOT West solar resource zone
Revenue: 20-year PPA at $38/MWh = $8.36M annual gross revenue
Tax benefit: 30% ITC ($27.6M) claimed in Year 1, reducing net invested cost to approximately $64.4M
Net operating income: Approximately $6.1M annually after O&M, lease, insurance, and management
Payback: Approximately 10.5 years on a simple cash basis; approximately 7.5 years with full ITC and MACRS depreciation tax structuring
This project worked financially. But note that the interconnection cost alone represented 15% of total project spend, a figure that was not known until 22 months after the initial site selection. That 22-month timeline forced two extensions of the land option agreement and added approximately $800,000 in carrying costs that weren’t in the original budget.
U.S. pipeline: Multiple projects exceeding 500 MW are in advanced development in Texas, Nevada, and Arizona for 2027 service entry, reflecting continued confidence in utility-scale solar economics despite interconnection and supply chain challenges.
Final Verdict: Is Utility-Scale Solar Worth It?
The economics are compelling across most of the U.S. in 2026. Solar is the lowest-cost new electricity source in most regions, the federal investment tax credit remains at 30% for projects meeting prevailing wage requirements, and the long-term demand signal from federal clean energy mandates is clear.
But “worth it” depends entirely on who’s asking.
For a utility or independent power producer evaluating a greenfield project in a favorable location with manageable interconnection costs: yes, in most scenarios. Projects in Texas, the Southwest, and parts of the Southeast continue to pencil out at competitive returns.
For a developer in a congested grid region, much of the Northeast and parts of the Midwest, interconnection cost uncertainty can make the same project unworkable. The physical resource may be there. The grid may not have room for the power at a cost that makes project financing viable.
For a landowner being approached about a lease, the economics are favorable at current lease rates, particularly compared to commodity crop returns on marginal land. The 25–30 year lease structure creates long-term income certainty that agricultural land rarely generates.
For a policymaker or grid planner: the scale of the interconnection queue backlog is the single most critical constraint on solar deployment in 2026. Not technology, not cost, not public opposition. Queue management and transmission buildout are the binding constraints on how quickly utility-scale solar can grow.
According to the EIA, utility-scale solar additions are projected to represent the largest share of new U.S. generating capacity through at least 2030. The installed base will roughly double from today’s levels within five years if current pipelines materialize, and that projection assumes current interconnection reform efforts succeed on roughly their current trajectory.
Projects that are sited well, structured correctly, and developed with a clear-eyed understanding of interconnection cost and permitting risk continue to demonstrate strong long-term economics. Projects that aren’t will continue to represent the majority of the 2,700+ GW sitting in interconnection queues, optioned, permitted, and waiting for a cost estimate that may never make the math work.
If you’re involved in a solar project at any stage, development, financing, or exit, and need to understand the contract or financial structure you’re working within, SolarInfoPath’s guide on understanding and exiting solar contracts covers the structural elements most people don’t fully understand until after they’ve signed.
For a complete overview of everything SolarInfoPath covers across solar finance, land, policy, and consumer protection topics, the SolarInfoPath resource library is the starting point.
FAQs
What counts as utility-scale solar?
Any solar project generating 1 MW or more, designed to sell electricity to the grid rather than serve a single building. Under U.S. federal definitions, 1 MW is the official threshold. Most developers apply a 5 MW practical minimum for viable project economics.
How many acres per MW solar?
The standard range is 5–10 acres per MW. Most modern projects using high-efficiency bifacial panels with single-axis trackers on flat terrain fall at 5–7 acres per MW. Older fixed-tilt systems on irregular terrain commonly require 9–11 acres per MW for the same output.
How much does a solar farm cost?
Installed costs range from $0.80M to $1.50M per MW in 2026. A 100 MW project typically costs $80M–$140M, including interconnection. Grid interconnection is the largest variable and the most commonly underestimated budget item.
What is the threshold for utility-scale solar?
The official U.S. federal threshold is 1 MW, as defined by the EIA. For tax credit eligibility, development finance underwriting, and FERC jurisdictional purposes, many lenders and investors apply a 5 MW functional minimum.
How many homes can 1 MW of power serve?
Approximately 150–250 homes per MW, depending on location. In high-sun states like Arizona and New Mexico, expect 220–250. In northern states like Michigan or Vermont, expect 150–175.
This article by SolarInfoPath (2026 research framework) is part of a comprehensive solar knowledge architecture covering all major high-value sectors including legal disputes (installation negligence, contracts, liability, fraud, lawsuits, liens, HOA and permitting disputes), financial structures (loans, PPA/lease agreements, DSCR financing, tax equity, investment and project finance), tax law (ITC, Section 48/25D, MACRS depreciation, bonus credits, IRS audits, recapture rules, domestic content and IRA/OBBBA compliance), insurance and risk (property damage, hail/wind/fire claims, bad faith insurance disputes, warranty coverage), policy and regulation (net metering, FERC interconnection, state utility rules, incentive programs and regulatory changes), commercial and utility-scale development (EPC contracts, construction delays, performance bonds, receivership, bankruptcy, asset sale and restructuring), real estate impacts (home value, solar leases, liens, title issues, HOA restrictions, easements), and emerging market structures such as battery storage, community solar, agrivoltaics, SRECs, yieldcos, and institutional investment funds. All content is based on publicly available regulatory, financial, and legal sources and is intended strictly for educational and informational purposes, not legal, tax, or financial advice. Readers should always verify current laws, utility policies, tax regulations, and contract terms with qualified licensed professionals before making decisions, as solar regulations, incentives, and financial structures frequently change across jurisdictions and time.

Solar Legal Analyst· Policy Researcher· Investigative Finance Writer Lead Analyst & Founder of SolarInfoPath
Morgan Lee is a solar legal analyst, policy researcher, and investigative finance writer with 12+ years of experience in U.S. renewable energy law, IRS tax credit compliance, and solar litigation. He is the founder of SolarInfoPath, a research-driven platform focused on primary-source analysis of solar contracts, tax law, regulatory policy, and industry disputes affecting homeowners and commercial developers.
His work is grounded in original legal and regulatory sources, including IRS notices, FERC and CPUC rulings, state court filings, PACER records, and UCC lien databases. He specializes in solar contract disputes, injury and workers’ compensation claims, PACE financing issues, tax equity structures, ITC recapture rules, MACRS depreciation, and federal and state solar policy frameworks.
Morgan’s analysis spans solar litigation, finance structures, and regulatory developments such as the IRA and OBBBA, interconnection reform, domestic content rules, and battery storage incentives. He also covers EPC contracts, PPAs, project financing, and utility-scale solar investment structures.