
Are solar farms profitable? Many are, but only when electricity sales cover construction costs, operating expenses, financing, and risk. Recent U.S. projects cost about $1.61/W AC to build (LBNL, 2024 projects), and profitability hinges on output, contract price, and tax-credit eligibility. A landowner’s lease income is a separate, lower-risk outcome.
Most profitability claims online skip one thing: who is earning the money. A landowner leasing acres to a developer receives a contract payment. The project owner earns electricity revenue, pays every cost, and carries every risk. Those are two very different financial questions.
This guide answers both, using dated benchmarks from Lawrence Berkeley National Laboratory (LBNL), the Department of Energy and the IRS. Every calculation shows its inputs, so you can rerun it with your own numbers.
One 2026 detail shapes everything below. Federal clean electricity credits for new solar now depend on construction-start and placed-in-service dates, so no article should promise a standard 30% credit for every new project.
What Determines Solar Farm Profitability?
Profit depends on whether lifetime revenue exceeds construction cost, operating expenses, financing, and taxes. Revenue alone proves nothing: a project can sell plenty of electricity and still produce weak or negative returns.
Five variables carry most of the weight:
- Installed cost: what it takes to build and connect the plant
- Annual generation: how many MWh the site actually delivers
- Sale price: the PPA rate or wholesale market price received
- Operating expenses: maintenance, insurance, taxes, and land rent
- Financing and tax treatment: interest, depreciation and credit eligibility
Revenue, Operating Profit, Cash Flow, and Investment Return
Each metric answers a different question, and mixing them up is the most common error in solar farm articles.
| Metric | What it measures |
| Gross revenue | Money from electricity and any eligible extra revenue |
| Operating expenses | Recurring costs of running the project |
| Operating cash flow | Cash from operations before financing and some adjustments |
| Net income | Accounting income after expenses and taxes |
| IRR | Modeled annualized return based on cash flows |
| NPV | Present value of future cash flows minus the investment |
The overlooked detail: an advertised “return” may be before or after financing and taxes. Always ask which one you’re looking at.
Solar Farm Profit per Acre: What Land Economics Can Tell You
Per-acre economics look completely different for a landowner and a project owner. The owner’s revenue per acre is far higher, but so are the costs and risks. A landowner’s lease payment is smaller but contractual.
When people search for solar farm profit per acre, they usually mean one of two numbers: the lease payment a landowner receives, or the project’s earnings spread across its footprint. This section shows both.
How Land Area Relates to Project Capacity
Total property acreage, total project footprint, and direct panel area are three different measurements. NREL- and DOE-supported research separates direct panel area from the full footprint, which also includes row spacing, access roads, drainage, and setbacks.
That’s why no single acres-per-MW number fits every site. Terrain, tracker choice, and environmental buffers all change the ratio.
| Measurement | What it includes |
| Total property | All land the owner holds |
| Project footprint | Fenced area, roads, drainage, buffers |
| Direct area | Ground under the panels themselves |
Landowner Income Versus Project Owner Profit
A landowner usually earns a fixed annual payment per leased acre, while the project owner earns electricity revenue minus all costs.
Illustrative comparison (hypothetical inputs): a 100 MW AC project on a 600-acre footprint.
| Party | Per-acre figure | What it represents |
| Landowner (hypothetical $1,000/acre lease) | $1,000 | Contract payment, low risk |
| Project owner, gross revenue | About $17,500 | Before any costs |
| Project owner, operating cash flow | About $10,450 | Before construction recovery, financing, taxes |
The owner’s per-acre figure looks larger, but it must repay roughly 268,000ofconstructioncapitalperacre(161 million ÷ 600. The landowner carries none of that.
Decision checkpoint for landowners: a lease offer’s value depends on escalators, payment start date and restoration terms, not just the headline rate.
How Much Do Solar Farms Make? Revenue and Generation
Annual revenue equals electricity delivered times the price received, and nameplate capacity alone can’t tell you either number. LBNL’s 2024 edition found a median capacity factor of 24%, with individual plants varying widely.
To answer how much solar farms make, start with generation, then apply the sale price.
Estimate Annual Electricity Generation
Generation (MWh) = AC capacity × 8,760 hours × capacity factor.
Illustrative example: 100 MW AC × 8,760 × 0.24 = 210,240 MWh per year
Capacity factor depends on solar resource, tracking, design, and curtailment. A sunnier site with trackers can beat the median, while a northern fixed-tilt site may fall below it.
| Capacity factor | Annual output (100 MW AC) |
| 20% | 175,200 MWh |
| 24% (LBNL median) | 210,240 MWh |
| 28% | 245,280 MWh |
Contracted Revenue Versus Market-Based Revenue
A PPA locks in a price for years, while merchant sales follow changing wholesale prices.
| Feature | PPA revenue | Merchant revenue |
| Price certainty | High during contract | Low |
| Upside potential | Limited | Possible |
| Downside risk | Buyer credit, curtailment | Price drops, congestion |
| Lender preference | Usually stronger | Usually weaker |
Revenue scenarios (hypothetical prices, 210,240 MWh):
| Price received | Annual revenue |
| $50/MWh | About $10.5 million |
| $60/MWh | About $12.6 million |
| $70/MWh | About $14.7 million |
Curtailment, when the grid can’t take power, cuts delivered MWh and therefore revenue. For contract structures, see how commercial solar PPA laws work.
Solar Farm Cost: Capital and Operating Expenses
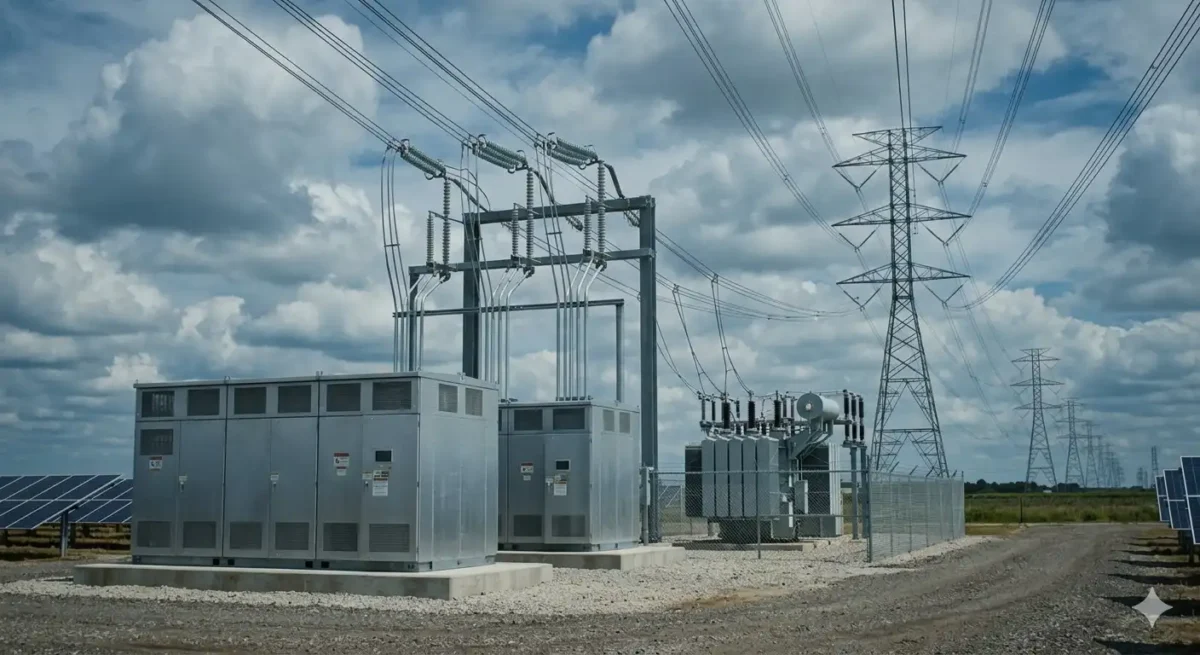
Recent benchmarks put U.S. installed cost at $1.43/W AC for 2023 projects and $1.61/W AC for 2024 projects in LBNL’s datasets. A realistic solar farm cost estimate also includes interconnection, development spending, and decades of operating expenses.
Initial Development and Construction Costs
Capital cost covers everything needed to reach commercial operation.
- Modules, inverters, and racking or trackers
- Engineering, procurement and construction (EPC)
- Site preparation, roads and drainage
- Permitting and environmental studies
- Interconnection and any grid upgrades
- Development and financing-related expenses
Interconnection is the wild card. Grid upgrades assigned to a project can add millions, and they often aren’t known until late-stage studies finish.
Ongoing Operating Expenses
Operating costs recur every year and reduce cash available to owners. DOE’s PV-only benchmark models O&M at about $20 per kWdc per year.
| Expense | Illustrative annual amount (100 MW AC) |
| O&M (~132 MWdc × $20/kW) | About $2.64 million |
| Land lease (600 acres × $1,000, hypothetical) | $600,000 |
| Property tax and insurance (hypothetical) | About $1.0 million |
| Total operating expenses | About $4.24 million |
Inverter replacement, vegetation management and monitoring belong in long-term budgets even when they’re not annual line items.
Cost Benchmarks and Their Limitations
Benchmarks differ by year, sample, region, and capacity basis.
| Source | Figure | What it represents |
| LBNL, 2023 projects | 1.43/WAC(1.08/W DC) | Historical sample average |
| LBNL, 2024 projects | $1.61/W AC | Historical sample average |
| DOE 2025 benchmark | 100 MW DC modeled system | Modeled, not a quote |
Never compare a per-watt DC figure with a per-watt AC figure without converting first. For deeper cost context, see utility-scale solar cost and land rules.
Solar Farm Income: Land Leases, PPAs, and Other Revenue
Revenue streams vary by project, and each should be counted only when eligibility and a contract or market basis exist. Solar farm income for a landowner usually means lease payments, while for an owner it means electricity sales plus any eligible extras.
| Revenue source | Who receives it | Key condition |
| Land lease payments | Landowner | Signed lease, project progress |
| PPA electricity sales | Project owner | Contract terms and delivery |
| Merchant sales | Project owner | Market prices |
| Renewable energy certificates | Project owner (usually) | Program eligibility |
| Storage and grid services | Project owner | Equipment and market rules |
Land Lease Payments
Lease terms vary widely by location, grid access, and project viability. Check these before signing:
- Annual rate and escalator
- When payments begin (option period vs. construction)
- Who pays property taxes and insurance
- Easement and access rights
- Decommissioning and restoration obligations
Many leases pay a smaller option fee during development and full rent only if construction proceeds.
Electricity Sales and Renewable Energy Certificates
Electricity sales are the core revenue, and RECs can add value where a program or market exists. REC values differ by state, so treat them as a separate, verified line rather than an assumption.
Storage and Additional Market Services
Batteries can shift solar output into higher-priced hours but add significant capital cost. Model storage as its own scenario with its own costs, rather than assuming it boosts profit automatically.
Calculate Solar Farm Profit With a Transparent Example
A simple operating cash flow model shows whether revenue can recover construction cost, before financing and taxes complicate the picture.
A Basic Operating-Cash-Flow Formula
Operating cash flow ≈ operating revenue − operating expenses. This leaves out construction investment, financing, taxes, depreciation, and future equipment replacement, so treat it as a first screen.
Illustrative Project Example
Hypothetical 100 MW AC base case:
| Input | Value | Basis |
| Capital cost | $161 million | LBNL $1.61/W AC |
| Capacity factor | 24% | LBNL median |
| Annual generation | 210,240 MWh | Formula above |
| Price received | $50/MWh | Hypothetical PPA |
| Annual revenue | $10.51 million | Generation × price |
| Operating expenses | $4.24 million | Table above |
| Operating cash flow | $6.27 million | Revenue − expenses |
| Simple payback (no credits) | About 25.7 years | $161M ÷ $6.27M |
Here’s the uncomfortable part. Without tax credits, this illustrative plant takes about 26 years to recover its cost, close to its working life. That’s why credits and contract price matter so much.
Downside and Sensitivity Scenarios
Small input changes move payback by years.
| Scenario | Operating cash flow | Simple payback |
| Base case | $6.27M | ~25.7 years |
| 30% credit applies (if eligible) | $6.27M | ~18.0 years |
| Price rises to $60/MWh | $8.37M | ~19.2 years |
| Price rises to $70/MWh | $10.48M | ~15.4 years |
| Capacity factor falls to 20% | $4.52M | ~35.6 years |
| Capital cost 20% higher | $6.27M | ~30.8 years |
LBNL’s analysis put the generation-weighted cost of 2024 projects near $60/MWh before tax credits. A $50 PPA without credits sits below that, which matches the weak base case above.
Financing, Tax Credits, and Project Returns
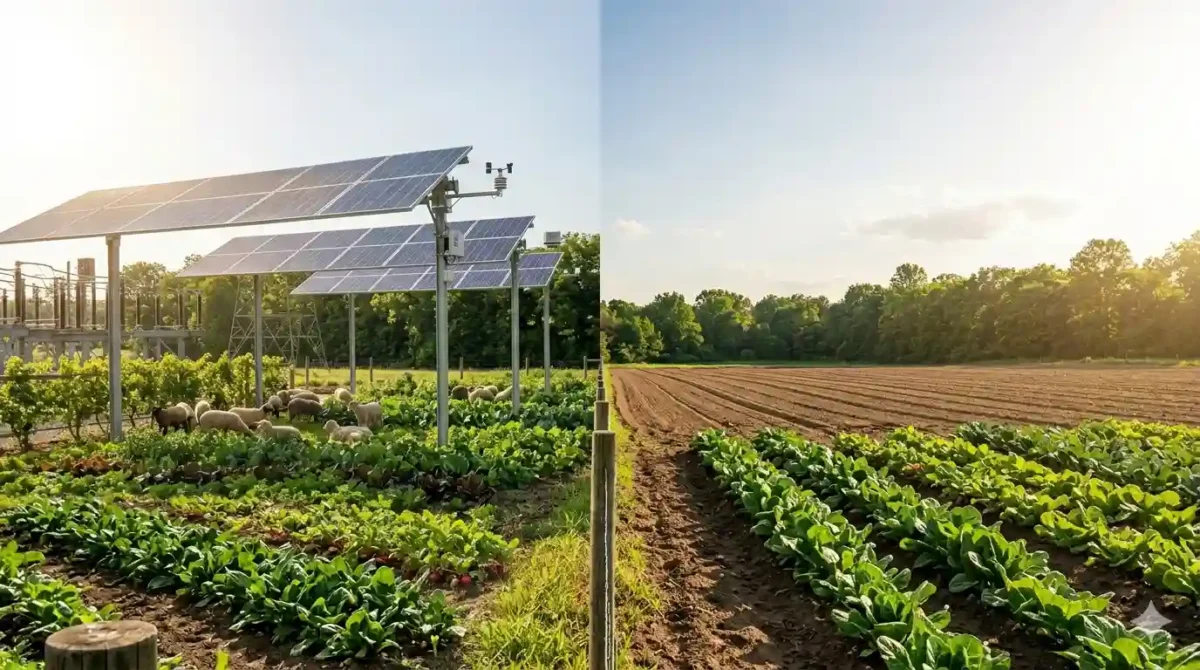
Financing and tax treatment can turn a marginal project into a viable one, or a viable one into a loss. That’s why IRR models matter more than simple payback for real investment decisions.
Debt and Equity
Debt lowers the equity needed but adds fixed repayment obligations. Lenders typically want contracted revenue and a comfortable debt-service coverage ratio before committing.
Higher interest rates raise debt service and cut cash available to equity investors. Many sponsors also bring in tax equity partners to use credits efficiently. See how solar tax equity partnerships work.
Federal Tax-Credit Eligibility
Section 48E credits are conditional, not automatic. Under the 2025 law, wind and solar facilities generally had to begin construction before July 5, 2026, or be placed in service by December 31, 2027, to qualify.
Check the IRS Clean Electricity Investment Credit page and current statute for your project’s facts. For compliance details, read IRS Section 48 energy credit compliance.
Payback, IRR, and NPV
Each metric answers a different question, and none guarantees success.
| Metric | What it tells you | Main limitation |
| Simple payback | Years to recover cost | Ignores time value and later years |
| IRR | Annualized modeled return | Sensitive to assumptions |
| NPV | Value created at a discount rate | Depends on the chosen rate |
Are Solar Farms Profitable Under Different Project Conditions?
Yes, under favorable conditions, and no under unfavorable ones. The deciding factors are site output, contract price, capital cost, financing, and credit eligibility working together.
| Condition | Favorable | Base | Downside |
| Capacity factor | 28% | 24% | 20% |
| Price received | $70/MWh | $50/MWh | $50/MWh |
| Capital cost | $1.43/W AC | $1.61/W AC | $1.93/W AC |
| Tax credit | Eligible | Uncertain | Not eligible |
| Likely outcome | Viable | Marginal | Weak |
In my view, the strongest predictor isn’t sunshine. It’s whether the project can secure a contract price above its cost of production before construction begins.
For an investor-focused look at the same question, see whether solar farms are worth it for investors.
Major Risks That Can Reduce Solar Farm Profitability
Delays, cost overruns, lower output, price changes, and policy shifts can each erase returns. Most failed projects fail before construction, during development.
Development and Grid Risks
Interconnection, transmission upgrades and permitting are the biggest development hurdles. Many projects in interconnection queues never reach operation.
| Risk | Effect |
| Interconnection delays | Missed credit deadlines, higher costs |
| Transmission upgrades | Millions in unplanned capital |
| Permitting disputes | Months or years of delay |
| Land unsuitability | Design changes or cancellation |
Read why interconnection delays stretch project timelines.
Revenue and Operating Risks
Lower prices, curtailment, and weaker output cut cash flow after the plant is built.
- Merchant prices may fall when many solar plants produce at once.
- Curtailment reduces delivered MWh.
- Panels degrade slowly over time.
- PPA expiry exposes later years to market prices.
Landowner and Decommissioning Risks
Landowners should confirm who pays to remove equipment and restore the land. Many jurisdictions require financial assurance such as a bond.
Construction can also create runoff and drainage disputes with neighbors. A real example is covered in solar farm runoff cases in Georgia.
Final Takeaways: Are Solar Farms Profitable?
Profitability is a project-specific result, not an industry promise. Before relying on any estimate:
- Separate landowner lease income from owner profit.
- Confirm capacity factor and price assumptions with real data.
- Use dated, unit-matched cost benchmarks.
- Verify tax-credit eligibility against current IRS rules.
- Stress-test the model with downside scenarios.
The projects that work combine strong output, a contract price above production cost, controlled capital spending, and confirmed incentives. The ones that struggle usually miss on at least two of those. Running your own numbers through the formulas here will tell you more than any average figure.
Frequently Asked Questions
How is solar farm profit calculated?
Revenue minus operating costs, financing, and taxes, measured over the project’s life.
How much land does a utility-scale project need?
It varies with design and terrain; separate total footprint from direct panel area.
Is land lease income the same as project profit?
No. Landowners get contract rent; owners earn electricity revenue and carry the risk.
What capacity factor do U.S. solar farms achieve?
LBNL reported a 24% median, with wide variation between plants.
Do all new solar farms get a 30% credit?
No. Eligibility depends on construction timing and other statutory conditions.
Does battery storage always raise profit?
No. It adds capital cost and depends on market prices and rules.
What happens when a PPA ends?
The project typically sells at market prices or signs a new contract.
Who pays for decommissioning?
Usually the project owner, as set by the lease, permits, and local rules.
This article by SolarInfoPath (2026 research framework) is part of a comprehensive solar knowledge architecture covering all major high-value sectors including legal disputes (installation negligence, contracts, liability, fraud, lawsuits, liens, HOA and permitting disputes), financial structures (loans, PPA/lease agreements, DSCR financing, tax equity, investment and project finance), tax law (ITC, Section 48/25D, MACRS depreciation, bonus credits, IRS audits, recapture rules, domestic content and IRA/OBBBA compliance), insurance and risk (property damage, hail/wind/fire claims, bad faith insurance disputes, warranty coverage), policy and regulation (net metering, FERC interconnection, state utility rules, incentive programs and regulatory changes), commercial and utility-scale development (EPC contracts, construction delays, performance bonds, receivership, bankruptcy, asset sale and restructuring), real estate impacts (home value, solar leases, liens, title issues, HOA restrictions, easements), and emerging market structures such as battery storage, community solar, agrivoltaics, SRECs, yieldcos, and institutional investment funds. All content is based on publicly available regulatory, financial, and legal sources and is intended strictly for educational and informational purposes, not legal, tax, or financial advice. Readers should always verify current laws, utility policies, tax regulations, and contract terms with qualified licensed professionals before making decisions, as solar regulations, incentives, and financial structures frequently change across jurisdictions and time.

Solar Legal Analyst· Policy Researcher· Investigative Finance Writer Lead Analyst & Founder of SolarInfoPath
Morgan Lee is a solar legal analyst, policy researcher, and investigative finance writer with 12+ years of experience in U.S. renewable energy law, IRS tax credit compliance, and solar litigation. He is the founder of SolarInfoPath, a research-driven platform focused on primary-source analysis of solar contracts, tax law, regulatory policy, and industry disputes affecting homeowners and commercial developers.
His work is grounded in original legal and regulatory sources, including IRS notices, FERC and CPUC rulings, state court filings, PACER records, and UCC lien databases. He specializes in solar contract disputes, injury and workers’ compensation claims, PACE financing issues, tax equity structures, ITC recapture rules, MACRS depreciation, and federal and state solar policy frameworks.
Morgan’s analysis spans solar litigation, finance structures, and regulatory developments such as the IRA and OBBBA, interconnection reform, domestic content rules, and battery storage incentives. He also covers EPC contracts, PPAs, project financing, and utility-scale solar investment structures.