
According to our research, utility rate filings and federal ITC data, solar panels are cheaper than grid electricity over a 7–12 year window for homes paying above $140/month, but only when utility rates exceed 13¢/kWh, roof orientation is favorable, and the homeowner plans to stay at least 8 years. Homes with bills below $100/month rarely reach break-even under current installed cost structures.
Solar Panels vs Electricity: What Homeowners Must Understand Before Comparing Costs
Most homeowners search “solar panels vs electricity” expecting a clear winner. The honest answer is: it depends entirely on your utility rate, your roof, and how long you plan to stay in your home. Neither solar nor grid electricity wins universally in 2026.
Why This Comparison Confuses Most Homeowners in 2026
The confusion starts before you even talk to an installer. Solar companies and utility companies both describe electricity in completely different ways, and that gap is where most homeowners get lost.
In 2026, at least 18 states will have utility companies running time-of-use (TOU) billing structures that most sales presentations never address. When an installer shows you a savings estimate based on a flat rate average, and your utility actually charges 22¢/kWh during peak hours (4–9 PM), your real savings calculation shifts dramatically. Installers who use flat-rate averages to build projections are not lying, but they are showing you the best-case version of a more complicated picture.
Marketing vs Reality in Solar Savings Claims
Solar savings estimates in 2026 typically range from $800 to $1,600 per year for a medium-usage home. That range is real, but it assumes your system produces at projected capacity every month, that utility rates stay flat, and that your net metering credits hold their current value.
None of those three assumptions is guaranteed.
How installers simplify electricity bills into misleading averages
Here is what actually happens during most sales presentations. The installer pulls your last 12 months of billing history, averages your monthly usage in kWh, and builds a system size around that number. That math is not wrong, but it ignores the billing structure entirely.
If your utility uses tiered billing, where the first 500 kWh per month costs 10¢ but anything above that costs 18¢, a solar system that offsets your upper-tier usage is significantly more valuable than one sized to your average. Most homeowners never hear this distinction.
Electricity is not a product: it’s a pricing system
This is the single concept that changes how you evaluate solar. Electricity is not priced like gasoline. You do not pay one price per unit. You pay a layered rate, base charges, energy charges, sometimes demand charges, plus taxes and fees.
Why utility billing structures vary by state and time-of-use rates
In California, PG&E residential customers face some of the highest marginal rates in the country, above 30¢/kWh for high-consumption tiers in 2026. In Louisiana, Entergy customers pay around 10–11¢/kWh flat. A solar system installed in both states might be identical hardware. The financial outcome is not even close.
This single variable, your utility’s rate per kWh, matters more than panel brand, inverter type, or installer reputation.
Solar Panels vs Electricity: The Real Meaning of “Cheaper”
Solar becomes cheaper than grid electricity when the total lifetime cost of owning a solar system, divided by the total kWh it produces, falls below your utility’s rate per kWh. That calculation sounds simple. In practice, several real-world factors complicate it.
When solar becomes cheaper than grid electricity
For most U.S. homes in 2026, solar reaches cost parity between years 7 and 12 after installation, depending on the state. After that crossover point, every kWh the system produces is functionally free electricity.
Role of the utility rate per kWh in the break-even calculation
| Utility Rate (¢/kWh) | Estimated Payback Period | Long-Term Savings Potential |
| Below 10¢ | 14–18 years (often not viable) | Low |
| 10–13¢ | 11–14 years | Moderate |
| 13–18¢ | 8–11 years | Strong |
| Above 18¢ | 6–9 years | Very Strong |
| Above 25¢ (CA, MA, CT) | 5–7 years | Exceptional |
When electricity is still the better financial choice
Solar does not make financial sense for everyone in 2026. That is not a popular thing to say, but it is accurate.
Low-consumption homes and short occupancy timelines
A homeowner paying $75/month to their utility on a flat rate of 10¢/kWh uses roughly 750 kWh/month. A system sized to offset that usage might cost $12,000–$15,000 before the 30% federal tax credit, leaving an out-of-pocket cost of $8,400–$10,500.
At $75 saved per month, that payback period stretches to 9–12 years under the most optimistic assumptions. If utility rates stay flat (some do), if the homeowner stays that long, and if no major repairs arise, they might break even. But if they sell the house in year 6 or 7, the financial gain is marginal at best.
If your monthly electricity bill is below $100 and you plan to move within 7 years, the numbers in most U.S. markets do not favor solar right now.
Solar Power vs Electricity: Are They Competing Systems or Connected Layers?
Solar power and grid electricity are not competing systems. They are connected layers. In 2026, the vast majority of residential solar installations remain tied to the grid, meaning you are not choosing one over the other. You are layering solar production on top of existing grid access.
What solar power actually produces
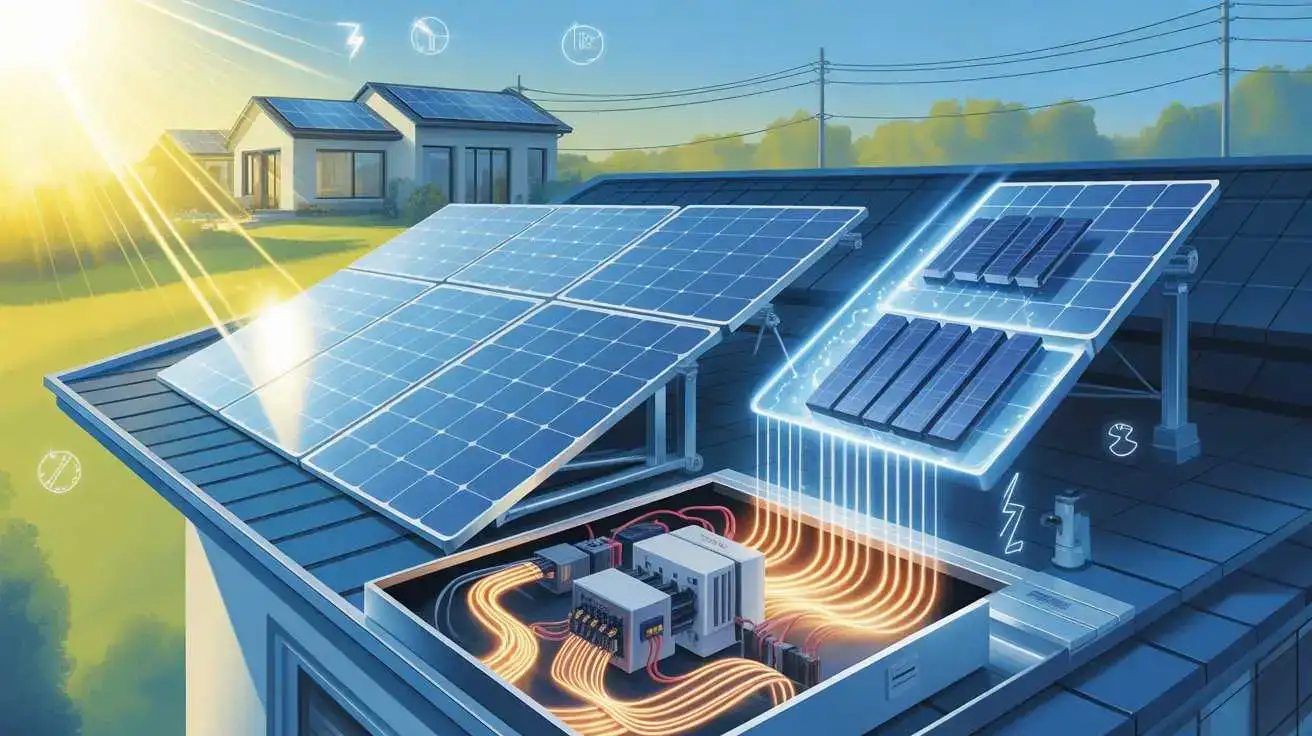
A solar panel system produces direct current (DC) electricity when photovoltaic cells absorb sunlight. That DC power is then converted to alternating current (AC) by an inverter before it powers anything in your home.
DC electricity generation from photovoltaic cells
Photovoltaic cells work by releasing electrons when photons from sunlight hit a semiconductor material, typically silicon. This electron movement creates direct current. The process itself is straightforward. The variability, cloud cover, panel angle, and temperature are where production gets complicated.
Conversion loss when turning DC into AC power
Every solar system loses some energy during the DC-to-AC conversion process. In 2026, standard string inverters typically operate at 96–98% efficiency. Microinverters perform similarly. But that is before you account for wiring losses, heat-related derate factors, and soiling losses from dust or debris.
A well-designed 8kW system in Arizona might realistically produce 7.2–7.5kW of usable AC power under peak conditions, not the full 8kW the nameplate suggests. This matters when sizing the system against your actual usage.
Why solar still depends on the grid
Here is something installers often gloss over: unless you have battery storage, your solar panels produce zero usable electricity at night. During those hours, you draw from the grid exactly as you did before installing solar.
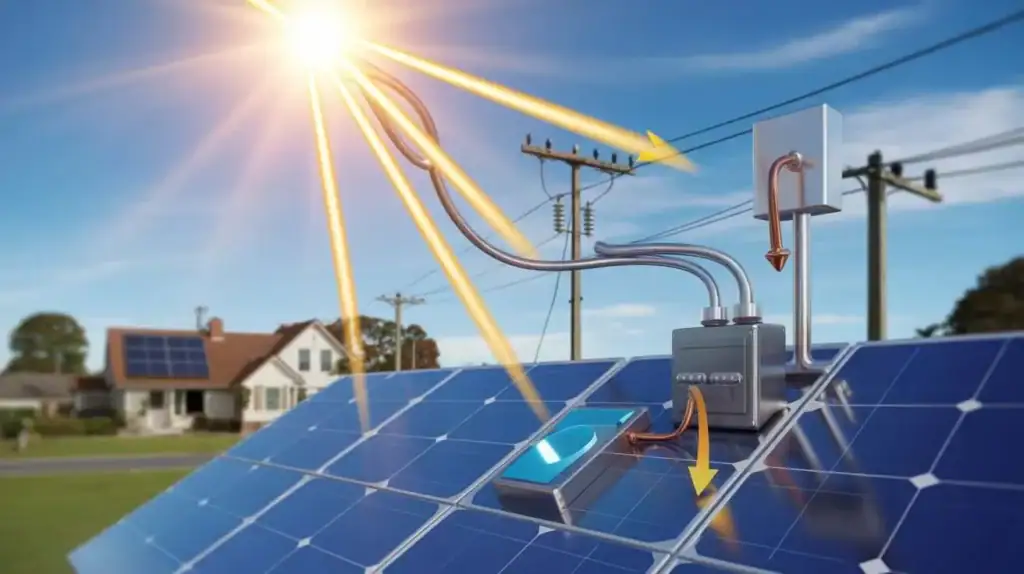
Net metering and grid synchronization explained simply
Net metering is the billing mechanism that makes grid-tied solar work financially. When your panels produce more electricity than your home uses at that moment, the surplus flows back to the grid. Your utility measures this export and applies a credit to your bill.
In most states with active net metering in 2026, that credit equals the retail rate you would have paid to consume that electricity, typically the same cents-per-kWh you pay coming in. But this is changing in some states, and that shift matters enormously for your long-term savings projection. More on that shortly.
How electricity actually reaches your home
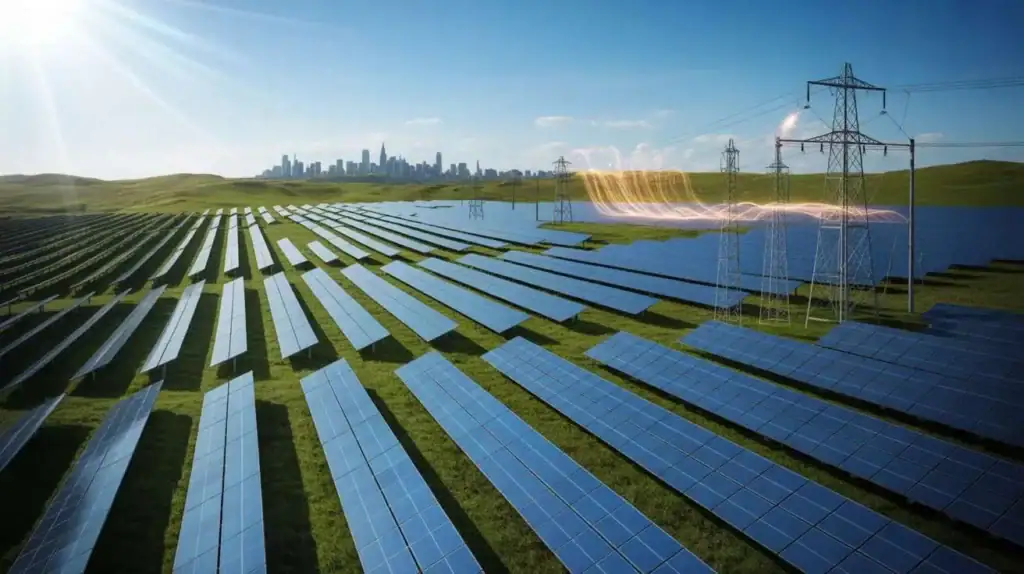
Grid electricity travels through three distinct stages before reaching your outlet: generation, transmission, and distribution. Understanding these stages explains why your rate includes more than just the cost of making electricity.
Power generation, transmission, and distribution breakdown
Generation happens at a power plant, coal, natural gas, nuclear, wind, or utility-scale solar. Transmission moves that power at high voltage across long distances. The distribution steps the voltage down and delivers it to your neighborhood and ultimately your meter.
Where cost increases happen in the grid system
The generation side of electricity has actually gotten cheaper in the last decade, especially as natural gas and renewables expanded. But transmission and distribution infrastructure, the poles, wires, transformers, and substations, require ongoing maintenance and upgrades.
Those infrastructure costs get passed to consumers through fixed charges on your bill. This is why your monthly electricity bill never fully disappears, even when solar covers 100% of your energy usage. The grid connection itself carries a cost that solar cannot eliminate.
Difference Between Solar Energy and Electricity: The Core Concept Homeowners Miss
Solar energy and electricity are not the same thing, and mixing up these terms leads directly to wrong expectations about system performance and savings. This distinction trips up more homeowners than almost any other topic in solar.
Solar energy explained in simple terms
Solar energy is raw energy from the sun. It arrives as light, photons, that carry energy but cannot directly power a lamp, a refrigerator, or a phone charger. It must be converted into a usable form first.
Sunlight as a raw energy input
Think of sunlight as ore before smelting. It contains the raw material for energy, but it needs processing before it becomes useful. The solar panel is the processing plant. It takes in solar energy and outputs DC electricity.
Panel efficiency and environmental limitations
In 2026, most residential solar panels convert 20–23% of the solar energy hitting their surface into electricity. The rest is reflected or lost as heat. This efficiency number matters because it directly affects how much roof space you need for a given system size.
A 400-watt panel under direct, perpendicular sunlight produces 400 watts. But angle it slightly off-south, add 2% cloud diffusion, raise the ambient temperature above 25°C, and that output drops. Production curves in sales presentations typically show summer peak conditions — not the full-year average.
Electricity explained in simple terms
Electricity is energy that has already been converted into a form your home can use. It flows through wires, powers devices, and is measured in kilowatt-hours (kWh) on your utility bill. It is always a processed output, never a raw source.
Converted and usable energy form
Whether it comes from a coal plant, a nuclear reactor, or your solar panels, the electricity arriving at your outlets is functionally identical. Your appliances do not know or care how it was made.
Why is electricity always a processed output, not a source
This matters for financial planning because every step in the conversion process, from sunlight to DC to AC to your outlet, carries a loss. When you see a solar system rated at 10kW, that is the maximum DC capacity of the panels. The actual AC electricity delivered to your home will always be somewhat lower.
Knowing this prevents a common sizing mistake: homeowners who see “10kW system” and assume their home will produce 10kW of usable power, only to find actual production falls 8–12% short.
Why mixing these terms leads to wrong financial expectations
When an installer says “this system will generate $1,400 worth of electricity per year,” they are translating solar energy into a dollar figure based on a series of assumptions — panel efficiency, inverter losses, local sun hours, and your utility’s rate. Each assumption has a range, not a fixed number.
Sales language vs engineering language
Sales presentations use the optimistic end of that range. Engineering assessments use the realistic middle. The gap between those two numbers is typically 8–15% in favorable conditions and can exceed 20% in states with significant cloud cover or seasonal variation.
How confusion affects system sizing decisions
A homeowner who buys a system sized to offset 100% of their usage, based on peak-condition production estimates, may find it actually offsets 85–90% under real conditions. That remaining 10–15% still comes from the grid, at full retail rates.
Over 25 years, that gap represents real money. Not a catastrophic loss, but enough to push the actual break-even point 1–2 years beyond what the proposal showed.
Solar Energy vs Electricity Cost Comparison (2026 Real-World Breakdown)
Based on SolarInfoPath’s review of 2026 installed cost data and utility rate filings, the average residential solar system costs $2.80–$3.40 per watt before incentives. After the 30% federal Investment Tax Credit (ITC), the effective cost drops to $1.96–$2.38 per watt, making a typical 8kW system cost $15,680–$19,040 out of pocket.
Average electricity cost by utility structure
Electricity pricing in 2026 falls into three main structures across U.S. utilities. Understanding which one applies to you is the first step in any real solar comparison.
Flat rate vs tiered billing vs time-of-use pricing
Flat rate billing charges the same cents per kWh regardless of how much you use or when. It is the simplest structure and the easiest to calculate savings against. Most rural co-ops and some smaller municipal utilities still use this model.
Tiered billing charges a lower rate for your first block of usage and a higher rate for anything above a set threshold. Utilities like Pacific Gas & Electric use aggressive tiering. In 2026, PG&E’s Tier 1 rate sits around 27¢/kWh for the first ~500 kWh, climbing to over 32¢ for usage above that. Solar offsets your most expensive tier first, which is why the savings math can be very compelling in high-tier states.
Time-of-use pricing charges based on when you use electricity, not just how much. Peak hours, typically late afternoon and evening, cost significantly more. Off-peak hours cost less. In 2026, utilities in California, Arizona, and several Northeast states will have moved most residential customers to TOU plans.
Why does peak-hour electricity change the total bill dramatically
Here is where the numbers shift in an unexpected direction. A homeowner on a TOU plan in Phoenix, Arizona, paying APS (Arizona Public Service) roughly 23¢/kWh during peak hours (3–8 PM) will find that solar panels produce their maximum output between 10 AM and 2 PM, before peak pricing begins.
This timing mismatch means solar production and peak-rate electricity consumption are not perfectly aligned. Without battery storage, some of your most expensive grid electricity still comes in during peak evening hours.
Solar system cost breakdown after federal ITC (30%)
The federal Investment Tax Credit (ITC) at 30% applies to the full installed cost of a residential solar system in 2026, including labor, equipment, and permitting fees. It is a dollar-for-dollar reduction in your federal tax liability, not a deduction from taxable income.
Installed cost per watt in 2026
| System Size | Gross Cost Range | After 30% ITC | Monthly Savings Est. (at 14¢/kWh) |
| 5kW | $14,000–$17,000 | $9,800–$11,900 | $50–$70 |
| 8kW | $22,400–$27,200 | $15,680–$19,040 | $80–$115 |
| 10kW | $28,000–$34,000 | $19,600–$23,800 | $100–$145 |
| 12kW | $33,600–$40,800 | $23,520–$28,560 | $120–$175 |
Regional variation in installation pricing
Installation costs are not uniform across the country. In 2026, states with high labor costs, California, New York, Massachusetts, and Connecticut, see installed costs consistently at the higher end of that range or above it. States with lower labor costs and more installer competition, such as Texas, Florida, Arizona, and North Carolina, tend toward the lower end.
Permitting and interconnection fees also vary. Some utilities charge $100–$200 for grid interconnection. Others, particularly in states with more aggressive solar adoption policies, have streamlined this to near zero. Interconnection queue backlogs, where applications wait weeks or months for utility approval, remain a real friction point in some markets in 2026, particularly in parts of California and the Southeast.
Payback period logic (real calculation model)
Payback period is the number of years it takes for cumulative solar savings to equal the upfront system cost. It sounds simple. The actual calculation involves more moving parts than most homeowners realize.
Monthly bill offset vs system production
Here is the formula in plain terms:
Annual savings = (kWh produced per year) × (utility rate per kWh)
For an 8kW system in Nashville, Tennessee, where TVA (Tennessee Valley Authority) residential rates average around 12¢/kWh in 2026, and average annual production for that system size is roughly 10,400 kWh:
Annual savings = 10,400 kWh × $0.12 = $1,248/year
After the 30% ITC on an $18,000 system, the out-of-pocket cost = $12,600.
Payback period = $12,600 ÷ $1,248 = approximately 10.1 years
That is financially workable for a long-term homeowner. It is not particularly compelling for someone who bought the house three years ago and might sell in five.
Why are savings not linear over time
One factor that genuinely works in solar’s favor over time: utility rates tend to rise. The U.S. Energy Information Administration (EIA) has documented average residential electricity price increases of approximately 2–4% annually over the past decade. If that trend continues, and there is no strong reason to assume it won’t, your solar savings grow each year while your system cost stays fixed.
The flip side: solar panels degrade at approximately 0.5–0.8% per year in output. After 25 years, your panels might produce 12–18% less electricity than they did on installation day. The degradation curve is gradual, but it is real and worth factoring into long-range projections.
Solar Panels Compared to Electricity: Real Household Scenarios (2026)
Low electricity usage home (under $100/month)
SolarInfoPath Reality Check: For homes paying less than $100/month, solar rarely makes strong financial sense in 2026 under standard grid-tied installation. The fixed cost of the system does not scale down proportionally with usage, but the savings do.
Why solar often struggles to break even
A homeowner in Raleigh, North Carolina, paying Duke Energy $82/month for 680 kWh of electricity faces a specific math problem. A system sized to offset that usage, roughly 5kW, would cost approximately $14,000–$17,000 before incentives, or $9,800–$11,900 after the 30% ITC.
At $82/month in savings, that payback period extends to 10–12 years. Add the reality that North Carolina’s net metering policy has seen legislative pressure in recent years, and the assumption that your credits will hold their current value for that full decade is not guaranteed.
Fixed installation cost vs low consumption mismatch
The core problem is structural: installation involves high fixed costs, permitting, racking, inverter, labor, that do not change based on how much electricity you use. A $2,000 inverter costs $2,000 whether you are offsetting $80/month or $300/month.
This is why solar installers in competitive markets increasingly push battery storage add-ons to low-consumption homeowners; it increases system value and total contract size simultaneously.
Medium usage home ($120–$250/month)
This is the sweet spot for residential solar in 2026. A home spending $120–$250/month on electricity has enough consumption to justify the system cost, enough bill reduction to reach break-even within 7–10 years, and enough usage to generate meaningful net metering credits.
Typical break-even range in most states
A homeowner in Phoenix, Arizona, paying APS around $180/month, roughly $2,160/year, on a 1,450 kWh average monthly consumption, sits squarely in favorable territory. Phoenix averages 6.0 peak sun hours per day, one of the highest in the country.
An 8kW system here would produce approximately 14,200 kWh/year. At APS’s effective blended rate of about 12.5¢/kWh in 2026, that is roughly $1,775/year in savings. After the 30% ITC on a $22,400 system, the out-of-pocket cost is $15,680. Payback period: approximately 8.8 years.
For a homeowner who bought their home in 2022 and plans to stay, that is a reasonable return.
Ideal solar adoption zone for homeowners
What makes this usage range the “ideal zone” is that the savings are large enough to matter financially, the system is sized for standard roof configurations, and the payback period fits realistically within common homeownership timelines.
High consumption home (above $300/month)
High electricity bills, driven by air conditioning, electric vehicles, pool pumps, or simply larger homes, create the strongest solar financial case in 2026.
Strong financial advantage of solar systems
A homeowner in Houston, Texas, paying Reliant Energy $340/month during peak summer cooling months, faces electricity costs that solar is genuinely built to address. Texas averages 4.8–5.5 peak sun hours daily, depending on region, and the deregulated Texas electricity market means rates have been volatile in recent years.
A 12kW system in Houston, sized for a high-consumption home, could produce approximately 16,800 kWh/year. At an average blended rate of 13¢/kWh, that represents approximately $2,184/year in offsets. After the ITC on a $36,000 system, the out-of-pocket cost is $25,200. Payback: roughly 11.5 years.
That seems long. But here is the part that changes the math: Texas electricity rates spiked significantly during extreme weather events in recent years, and the deregulated market creates upward rate pressure that is not present in states with regulated monopoly utilities. Every 1¢/kWh increase in your utility rate accelerates your payback by roughly 8–12 months at this consumption level.
Air conditioning load impact in hot climates
Solar systems in climate-heavy states like Texas, Florida, and Arizona perform best precisely when air conditioning demand peaks, summer afternoons. This natural alignment between peak solar production hours and peak home cooling load is one of the strongest genuine arguments for solar in Sun Belt states.
Solar vs Electric: What Actually Decides the Winner in Real Life
The solar industry will show you charts and projections. What actually determines whether solar makes financial sense for your specific home comes down to three variables more than anything else.
Utility rate per kWh (most important factor)
Your utility’s rate is the single most powerful variable in the solar vs electricity comparison. Everything else, panel efficiency, roof angle, and installer price, plays a secondary role.
High-rate states vs low-rate states
In 2026, states like California, Hawaii, Massachusetts, Connecticut, and New York pay the highest residential electricity rates in the country, often 25–35¢/kWh or above. In these markets, solar systems reach break-even faster, generate more annual savings, and carry a stronger financial case than nearly anywhere else.
States like Louisiana, Oklahoma, Arkansas, and Idaho maintain much lower rates, 9–12¢/kWh in most cases. Solar in these markets can still make sense, but the payback window is longer, and the margins are thinner.
Why does the same solar system perform differently depending on the location
Identical 8kW systems installed on identical south-facing roofs in San Diego and Baton Rouge will produce similar amounts of electricity. But the San Diego homeowner — paying SDG&E around 40¢/kWh in 2026 — saves nearly four times as much per kWh produced compared to the Louisiana homeowner paying 10¢/kWh. Same hardware. Completely different financial story.
Sunlight availability and peak sun hours
Peak sun hours measure the daily equivalent hours of full, direct sunlight. A location with 5 peak sun hours per day means that, on average, a 1kW solar array will produce 5 kWh per day. This number directly sets the ceiling on what your system can produce.
North vs south regional production differences
In general terms, southern states generate 20–35% more solar electricity per installed kW than northern states. A 10kW system in Miami produces roughly 14,600 kWh/year. The same system in Seattle produces approximately 9,800 kWh/year. That production gap has a direct dollar impact on savings and payback timelines.
Seasonal variation impact on yearly output
Production is not evenly distributed across the year. Summer months, longer days, and higher sun angles typically generate 40–50% more electricity than winter months in the northern two-thirds of the country. If your highest electricity bills happen in summer (air conditioning), this alignment works in your favor. If your highest bills happen in winter (electric heating), solar’s value diminishes.
Roof design and shading constraints
Even a perfectly sized system underperforms if the roof creates physical limitations. This is one of the most underestimated factors in solar decisions.
Orientation (south-facing advantage)
South-facing roofs in the Northern Hemisphere receive the most direct sunlight throughout the day. A true south orientation at a 30° pitch is considered optimal for most of the continental U.S. East or west-facing roofs produce roughly 10–20% less annually. North-facing sections of a roof are generally avoided entirely in system design.
Partial shading can reduce output by 20–40%
A chimney shadow, a nearby tree, or even an HVAC unit on the roof can dramatically reduce production from the affected panels. In traditional string inverter systems, one shaded panel reduces the output of the entire string, not just the shaded panel itself.
Microinverters and DC power optimizers solve this problem by allowing each panel to operate independently. They cost more, typically adding $0.20–$0.40 per watt to system cost, but can recover 15–25% of production lost to shading in affected installations.
Difference Between Solar Energy and Solar Power: Why It Matters Financially
Solar energy and solar power describe different stages of the same process. Solar energy is the raw sunlight captured by your panels. Solar power is the usable electricity delivered to your home after conversion. The gap between them, caused by panel efficiency limits, inverter losses, and environmental factors, is typically 15–25% of the energy that originally hit the panel surface.
Solar energy (input stage)
Solar energy enters the system as photons striking the panel surface. The panel’s job is to capture as much of that incoming energy as possible and convert it to DC electricity.
Sunlight absorption and DC creation
Modern monocrystalline panels in 2026 convert 20–23% of incoming solar energy into DC electricity. That means 77–80% of the solar energy hitting your roof is not captured; it is reflected or absorbed as heat. This is not a flaw; it is the current state of the technology. Efficiency continues to improve, but at a relatively slow pace compared to early solar decades.
Weather dependency and efficiency fluctuations
High temperatures actually reduce panel efficiency. Panels are tested at 25°C (77°F), but rooftop temperatures in summer can reach 50–65°C. Most panels lose 0.3–0.5% efficiency for every degree above the test temperature. In Phoenix during July, this temperature derate can reduce production by 10–15% on the hottest days, precisely the days when air conditioning demand peaks.
Solar power (output stage)
Solar power is what remains after conversion losses, the actual AC electricity flowing into your home’s circuits.
Usable electricity delivered to the home
The journey from solar energy to solar power involves at least two conversion steps, DC generation and AC inversion, plus transmission through wiring and any distribution losses within the home. Each step carries a small loss.
Inverter efficiency losses (5–15%)
Standard inverters in 2026 claim 96–98% peak efficiency, but they do not operate at peak efficiency all the time. During low-production periods, early morning, late afternoon, and partly cloudy conditions, efficiency drops. A realistic annual average inverter efficiency is closer to 93–96% when you factor in the full production curve.
Over a 25-year system lifespan, these inverter losses are not trivial. Most string inverters are also expected to require replacement at some point in a system’s life, an additional cost of $1,000–$2,500 that comprehensive financial analyses should include.
Is Solar Energy and Solar Power the Same Thing: Clear Answer Without Industry Confusion
No, solar energy and solar power are technically different, but the solar industry uses them interchangeably in marketing materials and sales presentations. Understanding the actual difference protects you from a specific type of financial miscalculation.
Why does the industry use these terms interchangeably
Marketing materials simplify. “Solar energy” sounds clean and broadly positive. “Solar power” sounds functional and modern. Both phrases test well with consumers, so companies rotate between them freely without technical intent.
Marketing simplification strategy
The phrase “your home will be powered by solar energy” is technically inaccurate — your home is powered by AC electricity generated from solar energy. That distinction sounds pedantic, but it has a real financial implication.
Why homeowners misunderstand system performance
When homeowners hear “solar energy powers your home,” they sometimes assume the system operates more independently from the grid than it actually does. This leads to surprise when their bill does not disappear and when production falls below the projected estimate in a cloudy month.
Technical difference that impacts savings
Solar energy (input) is measured in solar irradiance, watts per square meter hitting the panel surface. Solar power (output) is measured in AC kilowatt-hours delivered to your home. The financial calculation your installer presents is built on solar power, not solar energy. But the production estimates often work backward from solar energy data, applying efficiency assumptions at each conversion step.
Energy production vs usable power output
If those assumptions are optimistic, which they sometimes are in competitive sales environments, the power output projection will be higher than what actually arrives at your meter.
Effect on billing reduction accuracy
A 10% overestimate in projected production, multiplied by your utility rate, multiplied by 25 years of system life, represents a meaningful cumulative gap between promised savings and actual savings.
This is not fraud. It is the natural result of optimistic input assumptions compounding over time. The best defense is asking your installer to provide production estimates at both the P50 level (median expected outcome) and the P90 level (what the system would produce in a below-average year). Any reputable installer can provide both.
What Happens After Solar Installation: Real Grid Behavior Explained
Installing solar does not disconnect you from the grid. Your home continues to draw from and export to the utility network automatically. Understanding what happens to your bill after installation prevents a very common disappointment.
Net metering system explained simply
Net metering is a billing arrangement where your utility tracks both the electricity your solar system exports to the grid and the electricity your home draws from it. At the end of each billing cycle, you pay only for the net difference.
How credits are calculated per kWh exported
In states with full retail net metering, including most of the Northeast, Colorado, New Mexico, and several others in 2026, each kWh you export earns a credit equal to the retail rate you would have paid to consume it. If you pay 15¢/kWh to buy electricity, you earn 15¢/kWh credit for what you export.
This 1:1 credit ratio is what makes solar financially viable in most markets. Without it, excess production would earn only the wholesale rate, typically 3–6¢/kWh, and the economics would collapse.
Why are credits not equal to the retail electricity value in all states
Here is what most comparison articles skip: net metering policies are actively changing. California’s NEM 3.0, implemented in 2023, reduced export credits significantly for new solar customers, from near-retail rates to approximately 5–8¢/kWh in some rate structures. Hawaii, Nevada, and parts of Florida have also moved away from full retail net metering.
This matters for prospective buyers in 2026 because your installer’s savings estimate may be built on the current net metering rate, which is not guaranteed to hold for the next 15–20 years. For how IRS guidelines intersect with solar incentive programs, reviewing federal energy credit compliance resources provides useful policy context.
Why your electricity bill never becomes zero
Almost every homeowner expects their bill to disappear after going solar. It rarely does.
Fixed grid charges and minimum utility fees
Every utility in the U.S. charges some form of fixed monthly fee just for maintaining your grid connection, regardless of how much electricity you use. These charges appear as customer charges, distribution charges, or minimum monthly bills on your statement.
In 2026, these fixed monthly charges typically range from $7 to $25, depending on the utility. Some utilities have pursued increases to these fixed charges specifically in response to growing solar adoption, because solar customers reduce energy revenue while continuing to use grid infrastructure.
Hidden charges most installers don’t emphasize
Beyond fixed charges, some utilities impose additional fees on solar customers specifically, sometimes called “solar surcharges” or “grid access fees.” Arizona, Indiana, and Wisconsin have seen utilities propose or implement such fees in recent years. A $15–$20/month surcharge does not ruin solar economics, but it does change the break-even calculation in ways that a savings estimate made before that fee existed will not reflect.
Solar vs Electricity: Financial Decision Framework (2026)
Break-even threshold logic
For a simple rule of thumb in 2026: if your monthly electricity bill exceeds $130 and your utility charges above 12¢/kWh, solar deserves serious evaluation. Below those thresholds, the math gets significantly harder.
Minimum bill size required for solar to make sense
This is not a universal cutoff; it is a starting point. Homes with bills between $100 and $130 can still find favorable economics in high-rate states like California, Massachusetts, or New York. But in low-rate states, that same bill range often produces payback periods above 14 years, which most financial advisors would describe as a marginal investment.
Payback period ranges (5–12 years typical)
The realistic payback range for most U.S. residential solar systems in 2026 is 7–12 years. Five-year payback is achievable in very high-rate states with strong sun exposure and low installed costs. Payback beyond 12 years typically indicates a mismatch between system size and usage, a low utility rate, or a market with weak solar resources.
Decision checkpoint: If your payback period estimate exceeds 12 years, it is worth asking what assumption is driving that number, and whether that assumption is realistic. Is it the utility rate, the production estimate, or the system cost?
Time horizon matters more than upfront cost
A homeowner focused entirely on upfront cost often misses the more important variable: how long they plan to stay.
Why short-term homeowners rarely benefit
Solar is a long-term asset. Its financial value compounds over time, through avoided electricity costs, potential rate increases, and accumulated net metering credits. The homeowner who installs solar in year one and sells in year five may recoup some value through potential home sale price improvement, but they will not have reached break-even on their investment.
Moving within 3–5 years changes the entire calculation
Research on solar’s effect on home resale value is genuinely mixed in 2026. Owned solar systems (not leased) add some value in most markets, but the dollar-for-dollar recovery is not guaranteed and varies significantly by location, buyer pool, and local solar market familiarity.
If there is any real possibility you will move within 5 years, approach solar with serious financial caution. For homeowners navigating complex solar contracts and potential sale scenarios, understanding solar project financial obligations before signing anything is worth your time.
When electricity remains the better choice
Sometimes staying on the grid is simply the more financially sound decision. Saying this honestly is part of what makes this analysis credible.
Low consumption + stable utility rates
A retiree in a small home in suburban Memphis, Tennessee, paying Memphis Light, Gas & Water around $90/month on a flat rate of 10¢/kWh, lives in a stable-rate environment with relatively modest consumption. The system cost to offset that usage versus the 12–14 year payback at current rates may simply not justify the financial commitment.
Renters and short-term property ownership scenarios
Renters cannot install solar in most circumstances. Homeowners who expect to sell within 3–4 years face the same practical constraint. For these households, the more practical path in 2026 may be switching to a utility green energy program, available through many utilities at a modest premium, rather than a capital installation that will not pay back during their tenure.
Key Hidden Factors Most Comparison Articles Ignore
Utility policy changes over time
The financial case for solar in 2026 is built partly on current policy, net metering rates, fixed charges, export credit structures that can change with regulatory decisions your installer has no control over and no ability to predict.
Net metering reduction trends in some states
California’s NEM 3.0 is the most prominent recent example, but it is not the only one. Utilities in Arizona, Louisiana, Nevada, Indiana, and Florida have all taken steps in recent years to reduce the value of rooftop solar exports. These changes did not eliminate solar’s value, but they moved the goalposts.
Why future savings may differ from today’s estimates
A solar savings estimate built in 2026 typically assumes current net metering rates hold for the system’s 25-year lifespan. That is a projection, not a guarantee. Utility commission decisions, state legislation, and federal energy policy can all affect the value of your exported solar electricity in ways no installer can promise you against. For context on how state and federal regulations interact with solar investments, the U.S. Energy Information Administration’s residential energy data provides ongoing tracking of rate trends.
Panel degradation over time
Every solar panel produced degrades over time. This is physics, not a manufacturing defect.
0.5% to 0.8% annual output loss
Premium panel manufacturers in 2026 typically warrant 80–82% of original production capacity at year 25, implying a degradation rate of approximately 0.5–0.7% per year. Budget panels from manufacturers without a strong U.S. warranty support history may degrade faster.
25-year performance reality vs marketing curves
Marketing materials almost always show production curves starting high and declining gradually. What they less often show: year-15 and year-20 production are meaningfully lower than year-1. For a homeowner relying on solar to cover a large portion of their electricity needs, that degradation means a gradual return of some grid dependence over time, and a gradual increase in their electricity bill even as the solar system continues producing.
A realistic 25-year financial projection should apply the actual degradation curve, not a flat production assumption. Very few proposals do this by default. Asking your installer for a degradation-adjusted production model is entirely reasonable and reveals a lot about how conservatively they approach their estimates. For insight into what a typical solar installation timeline looks like from contract to first production, that context also matters for planning purposes.
Final Decision Map: Solar Panels vs Electricity (2026 Reality)
After everything covered in this analysis, the decision comes down to a small number of conditions that either support or undermine solar’s financial case for your specific situation.
Solar is financially strong when…
The clearest case for solar in 2026 combines several favorable factors at once. When these conditions exist together, solar is difficult to argue against from a purely financial standpoint.
High electricity bills + strong sun exposure
A home paying above $150/month in a state with above-average sun exposure, the Sun Belt, much of the Southwest, the mid-Atlantic coast, and parts of the Southeast, sits in highly favorable territory. The combination of high savings per kWh and strong annual production creates the shortest payback windows and the most compelling long-term financial return.
Stable long-term property ownership
A homeowner who has lived in their home for five or more years and plans to stay for another decade or more has the time horizon that makes solar’s financial math work. The break-even point, wherever it falls in the 7–12 year range, becomes a milestone rather than a deadline — and everything beyond it is genuine financial gain.
What I found when reviewing solar adoption data across multiple high-rate states is that the homeowners who express the strongest financial satisfaction with their solar decisions are overwhelmingly those who had both high bills and long residency timelines. The hardware performs similarly across cases; the outcomes diverge based almost entirely on these two human factors. For homeowners evaluating larger-scale solar options, the economics of utility-scale solar offer a useful comparison context.
Electricity is financially stronger when…
There is no shame in concluding that staying on the grid is the right call for your situation. In fact, making that conclusion after a careful analysis is exactly the kind of informed decision this content exists to support.
Low usage + weak sun + short stay
A homeowner in Seattle, Washington, paying Puget Sound Energy $95/month on a bill that reflects the region’s moderate electricity rates and limited winter sun hours, who expects to sell the house in the next four years, has almost no favorable conditions for solar.
Low bill → small savings pool. Low sun hours → smaller system production. Short timeline → no path to break-even. The same financial resources directed toward home improvements with clearer resale value would almost certainly produce better returns.
Utility rates remain low or stable
Some states have maintained relatively stable, low electricity rates for years. If your utility has a track record of modest rate increases and no dramatic billing structure changes, the urgency argument for locking in a fixed solar cost is weaker.
Electricity rates have risen nationally over time. But rate trajectories vary by state, by utility, and by regulatory environment. A homeowner in a state with active rate oversight and historically stable rates faces a different calculus than one paying an unregulated or high-volatility utility.
Frequently Asked Questions
Is solar energy cheaper than electricity in 2026?
Over a full ownership period, solar typically costs less per kWh than grid electricity for homes in high-rate states. In low-rate states below 11¢/kWh, the cost advantage is marginal or may not exist.
What is the difference between solar energy and solar power?
Solar energy is raw sunlight captured by panels. Solar power is the usable AC electricity delivered to your home after efficiency losses through conversion. The gap between them is typically 15–25%.
Why does my electricity bill not disappear after installing solar?
Fixed utility charges, minimum monthly fees, and nighttime grid usage remain even when solar covers 100% of your energy consumption during daylight hours.
How long does a solar system take to pay for itself?
Most residential systems in 2026 pay back in 7–12 years, depending on utility rate, sun exposure, system cost, and how accurately the production estimate reflects real-world conditions.
Does solar increase home value?
Owned solar systems (not leased) tend to add some value in most markets, but the amount varies significantly by location and buyer pool. The addition is not dollar-for-dollar in every market.
Is net metering available everywhere?
No. Net metering policies vary by state and utility. Some states have reduced or modified net metering programs in recent years, which directly affects the long-term savings calculation for new solar customers.
What happens to solar savings if I move?
If you move before reaching break-even, your financial return depends on whether the home sale price reflects the solar system’s value. Leased systems add contractual complexity to any home sale.
This article by SolarInfoPath (2026 research framework) is part of a comprehensive solar knowledge architecture covering all major high-value sectors including legal disputes (installation negligence, contracts, liability, fraud, lawsuits, liens, HOA and permitting disputes), financial structures (loans, PPA/lease agreements, DSCR financing, tax equity, investment and project finance), tax law (ITC, Section 48/25D, MACRS depreciation, bonus credits, IRS audits, recapture rules, domestic content and IRA/OBBBA compliance), insurance and risk (property damage, hail/wind/fire claims, bad faith insurance disputes, warranty coverage), policy and regulation (net metering, FERC interconnection, state utility rules, incentive programs and regulatory changes), commercial and utility-scale development (EPC contracts, construction delays, performance bonds, receivership, bankruptcy, asset sale and restructuring), real estate impacts (home value, solar leases, liens, title issues, HOA restrictions, easements), and emerging market structures such as battery storage, community solar, agrivoltaics, SRECs, yieldcos, and institutional investment funds. All content is based on publicly available regulatory, financial, and legal sources and is intended strictly for educational and informational purposes, not legal, tax, or financial advice. Readers should always verify current laws, utility policies, tax regulations, and contract terms with qualified licensed professionals before making decisions, as solar regulations, incentives, and financial structures frequently change across jurisdictions and time.

Solar Legal Analyst· Policy Researcher· Investigative Finance Writer Lead Analyst & Founder of SolarInfoPath
Morgan Lee is a solar legal analyst, policy researcher, and investigative finance writer with 12+ years of experience in U.S. renewable energy law, IRS tax credit compliance, and solar litigation. He is the founder of SolarInfoPath, a research-driven platform focused on primary-source analysis of solar contracts, tax law, regulatory policy, and industry disputes affecting homeowners and commercial developers.
His work is grounded in original legal and regulatory sources, including IRS notices, FERC and CPUC rulings, state court filings, PACER records, and UCC lien databases. He specializes in solar contract disputes, injury and workers’ compensation claims, PACE financing issues, tax equity structures, ITC recapture rules, MACRS depreciation, and federal and state solar policy frameworks.
Morgan’s analysis spans solar litigation, finance structures, and regulatory developments such as the IRA and OBBBA, interconnection reform, domestic content rules, and battery storage incentives. He also covers EPC contracts, PPAs, project financing, and utility-scale solar investment structures.