
Solar panels for home use convert sunlight into electricity a household can use directly, store in a battery, or export to the grid. A rooftop solar system is really a collection of individual panels wired together with an inverter and mounting hardware, not a single unit, and that distinction matters once you start comparing quotes.
Homeowners researching this topic usually want answers to the same handful of questions: how many panels a home needs, what a system costs, how much electricity it can realistically produce, whether it can cover the home’s entire usage, and whether a battery is required. The right answer to each depends on electricity consumption, roof conditions, local sun exposure, and the household’s own priorities, which this guide walks through in order.
What Are Solar Panels Home Use?
Residential solar panels are photovoltaic modules designed for installation on or near a single-family home, sized and wired for household electrical loads rather than industrial ones. Each panel contains photovoltaic cells that convert sunlight directly into direct-current electricity.
A complete home system includes more than just panels: an inverter, mounting equipment, electrical wiring and safety equipment, a monitoring system, and a battery if one is included. Some homes run grid-connected systems that stay tied to the utility, while a smaller number run off-grid, relying entirely on their own generation and storage.
How Do They Work in a House?
Sunlight reaches the photovoltaic cells and generates direct-current electricity. An inverter then converts that direct current into the alternating current that a home’s outlets and appliances actually use. The home draws on that electricity first, and any excess may be exported to the grid, depending on the utility’s own rules.
Solar Panels for Residential Use vs. Commercial Systems
Solar panels for residential use differ from commercial systems mainly in size and design. A home system typically works within the roof area and electrical service of a single house, while commercial systems often require different engineering, larger equipment, and different interconnection agreements entirely. Commercial and industrial solar deals sometimes use dedicated power purchase structures; this overview of commercial solar PPA laws shows how differently those larger contracts are put together compared with a typical homeowner’s purchase or lease agreement.
How Many Does a House Need?
Panel count depends primarily on electricity consumption, not home size. Annual electricity use, the wattage of the panels chosen, local solar resource, roof orientation, shading, and system losses all factor into the final number, which is why two similarly sized homes can end up with very different systems.
How to Estimate the Number of Panels
As an illustrative example only: a home using 10,000 kWh a year, paired with 400-watt panels, would need a certain number of panels based on expected annual production per panel in that location. The actual figure depends heavily on local conditions, so this kind of calculation is a starting point, not a universal panel count for every household.
Does a Larger House Need a Bigger System?
Square footage isn’t the primary sizing variable; electricity usage is. Electric heating, cooling, water heating, and EV charging can push a smaller home’s electricity use, and therefore its panel count, well above that of a larger but more efficient house. Actual results vary by state and utility; this look at real solar adoption data out of Ohio is a useful reminder that local conditions, not just house size, drive the final system design.
Solar Panels for Home Use and Electricity Consumption
Solar production has to be understood against a household’s actual electricity consumption, not just its total annual usage. Monthly usage varies with the seasons, and production and demand don’t always line up in time, since a system generates during daylight hours regardless of when the home actually needs the electricity.
Solar Panels for Low-Electricity Homes
Solar panels for low-electricity homes generally allow for a smaller, less expensive system, since there’s simply less usage to offset. Fixed utility charges can remain in place even with substantial solar generation, so a smaller electricity bill doesn’t automatically mean solar has no value; the economics still come down to installed cost weighed against utility compensation for the electricity actually offset.
Can a Residential System Cover 100% of Home Electricity Use?
Annual energy offset and real-time consumption are two different things. A grid-connected system can offset 100% of a home’s annual usage on paper while the home still draws electricity from the grid at night or during heavy winter production shortfalls. A battery can shift some of that daytime production for later use, but batteries change the timing of self-consumption more than the underlying annual offset number.
Solar Electricity for Home Price: What Determines the Cost?
There’s no single nationwide number for solar electricity for home price, since the total depends on several cost components stacked together: the panels themselves, the inverter, racking, labor, electrical work, permitting, system design, and battery storage if included. Gross price and net cost after applicable incentives are two different numbers worth keeping separate when comparing quotes.
What Affects Solar Electricity for Home Price?
System size, equipment type, roof complexity, any needed electrical upgrades, location, labor rates, battery inclusion, and financing terms all move the final number. A homeowner comparing quotes should expect meaningful variation across these factors even within the same city. For context on how these upfront costs translate into a return over time, this breakdown of the solar payback period across the USA walks through how long it typically takes for the electricity savings to offset the initial investment.
A Quick Answer on Solar Electricity for Home Price
There isn’t one number that applies everywhere, but as a general range, solar electricity for home price most often lands somewhere in the tens of thousands of dollars before incentives, with the specific figure depending entirely on the factors above. Anyone requesting multiple quotes should ask each installer to break down solar electricity for home price the same way, so the numbers can actually be compared side by side.
Cash Purchase vs. Financing
Cash purchase, solar loans, leases, and power purchase agreements are the main ownership paths, and each carries a different total financial obligation, not just a different monthly payment. Contract terms matter here more than homeowners sometimes expect; those unhappy with how a contract was sold to them sometimes look into options like this guide on canceling a solar panel contract in Texas, which is a reminder to read cancellation terms carefully before signing anything.
Disputes over financing or contract terms aren’t the only kind that come up; equipment or workmanship problems can also end up in court in serious cases, and this overview of solar panel lawsuits in California shows the kinds of claims homeowners have pursued when a system genuinely underperformed or was installed poorly.
Rooftop, Ground-Mounted, and Other Mounting Options
Most residential installations fall into one of a few standard configurations, each with its own tradeoffs.
Rooftop Mounting
Rooftop mounting is the most common residential configuration. Roof orientation, shading, roof age and condition, and available roof area all determine how well a given roof suits a rooftop array. Installation itself typically moves faster than most homeowners expect once permitting clears; this look at how long solar installation actually takes in America breaks down the physical install timeline separately from the permitting and utility approval steps that usually take longer.
Ground-Mounted Residential Solar
Ground-mounted systems become useful when roof space is limited or poorly oriented. They require available land, additional structural work, and can carry different installation costs than a comparable rooftop system.
Solar Canopies and Carports
Solar canopies and carports offer another mounting option distinct from conventional rooftop installations, with their own structural requirements tied to supporting the array above a driveway or parking area.
Solar Panel for Home Use: What Size System Does a Home Need?
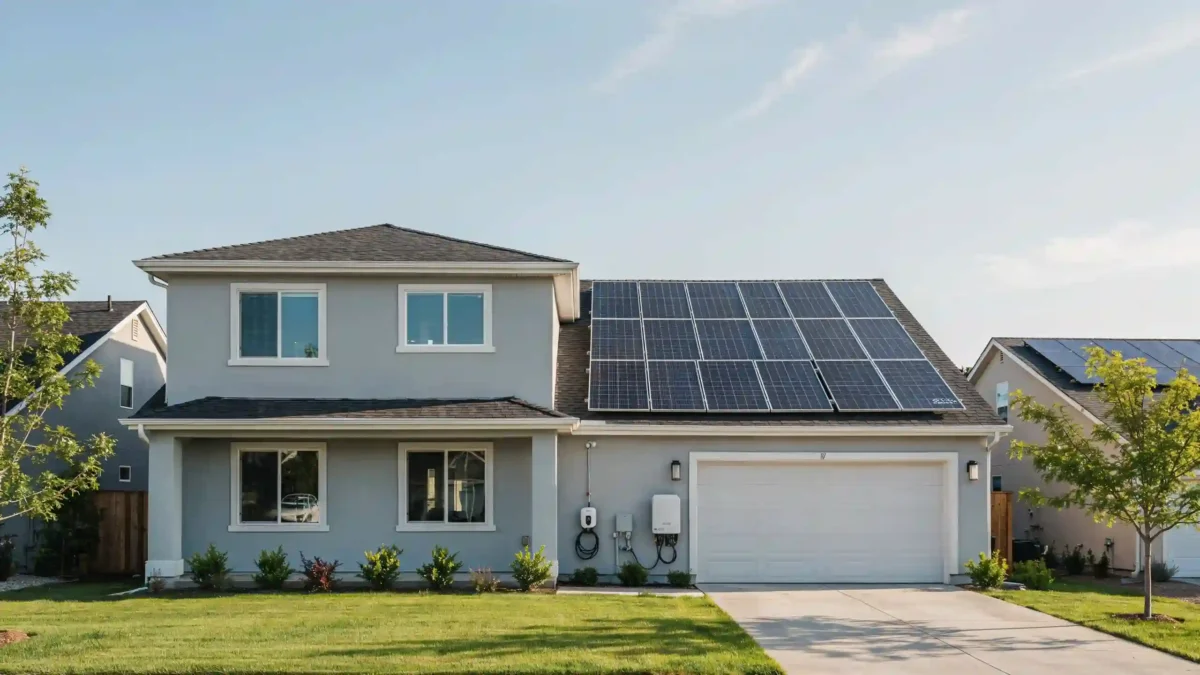
System size is measured in kW and connects directly to expected annual kWh production; panel wattage and total system capacity are related but distinct numbers worth understanding separately when comparing proposals.
A Small Solar Panel for Home Use
A small solar panel for home use setup suits lower electricity consumption and more limited roof space, though it naturally comes with a lower ceiling on how much of a home’s usage it can offset.
Larger Residential Solar Systems
Higher electricity consumption, EV charging, electric heating, larger homes, and greater available roof or ground-mount area all point toward a larger system. Some households considering electrification alongside solar find that a solar panel for home use sized only for today’s usage becomes undersized within a few years.
Solar Panel for Home Use: Small vs. Large, Side by Side
Matching system size to actual and reasonably anticipated future usage, rather than current usage alone, tends to produce the best long-term result for a solar panel for home use investment.
Solar Panels for Residential Houses: Important Home Requirements
Several home-specific factors determine whether a given house is a good fit for solar panels for residential houses: roof condition, roof space, roof orientation, shading, electrical panel capacity, local permitting requirements, and utility interconnection rules.
Roof Requirements for Solar Panels for Residential Houses
Roof age matters because removing and reinstalling panels later for a roof replacement adds real cost and disruption. Homeowners should weigh the roof’s remaining useful life against the solar system’s expected lifespan before installation, not after.
Can Solar Be Installed on Any Roof?
Roof material and structural condition both factor into suitability, and a proper answer requires a site-specific assessment rather than a general rule. Shading and roof geometry can rule out an otherwise structurally sound roof, which is exactly why solar panels for residential houses need a site visit rather than a phone-only quote.
Solar Panels for Residential Houses With Unusual Roofs
Homes with complex rooflines, multiple angles, or older structural framing may still qualify for solar panels for residential houses, though the design and mounting approach usually costs more than a simple, unobstructed roof.
Domestic Solar Panels: What Makes a System Residential?
Domestic solar panels are, at their core, systems sized and engineered for a single household’s electrical service rather than for a business, campus, or utility-scale project. Utility-scale and data-center-scale solar projects involve an entirely different tier of financing and legal structure; this guide to data center solar PPA arrangements in Ohio illustrates just how far removed that world is from a homeowner signing a single residential contract.
Residential Solar Panel System Components
| Component | Purpose |
| Panels | Generate electricity |
| Inverter | Converts DC electricity to AC |
| Racking | Secures panels |
| Wiring | Connects system components |
| Monitoring | Tracks system performance |
| Battery | Stores electricity when included |
| Meter | Measures electricity flow according to utility requirements |
What Sets Domestic Solar Panels Apart From Larger Projects
Financing domestic solar panels is comparatively simple next to a utility-scale deal. Larger commercial and utility projects often involve dedicated project finance counsel; this overview of the role a solar project finance attorney plays on bigger deals underscores how much smaller and more standardized a typical homeowner’s financing decision really is by comparison.
Domestic Solar Panels in Practice
Most homeowners will never need anything close to that level of legal or financing complexity; a residential system is, by design, a far simpler purchase.
Solar Panels for Residential Use: What Are the Main Benefits?
The main benefits of solar panels for residential use are generating electricity at the property, potentially reducing electricity purchases from the grid, producing power during daylight hours, and gaining a degree of energy independence. Battery integration can add further functionality on top of these core benefits, and long-term electricity-cost trends factor into the overall value case as well.
Do Solar Panels for Residential Use Actually Pay Off?
For most households, the answer is yes over the system’s lifetime, though the timeline depends on the same cost and consumption factors covered earlier in this guide. Households weighing solar panels for residential use against simply staying on the grid should run their own numbers rather than relying on a generic national estimate.
Solar and Home Electricity Bills
A bill typically combines energy charges, fixed charges, and credit for exported electricity, all shaped by the local utility’s rate structure. Solar reduces the energy-charge portion in most cases but doesn’t necessarily eliminate a bill entirely, since fixed charges and net export policy both remain in play. Homes exporting meaningful electricity back to the grid should understand their state’s specific compensation rules; this look at whether net metering is worth it across the USA explains how much that compensation can vary from one utility to the next.
Do Solar Panels Add to a Home’s Resale Value?
Beyond the electricity-bill savings, an owned system can be a selling point when the home eventually goes on the market. This look at how much faster houses with solar tend to sell is a useful data point for homeowners weighing solar partly as a long-term property investment rather than purely a utility-bill decision.
Solar Panels for Low-Electricity Homes: Are They Still Worth Considering?
Lower electricity use generally means less to offset, which pushes the appropriate system toward a smaller size. Fixed utility charges persist regardless of system size, so the comparison that actually matters is upfront cost against realistic annual savings, not upfront cost against total electricity use.
What If a Home Uses Very Little Electricity?
Calculating the realistic annual offset for a genuinely low-usage home often reveals that a smaller system, rather than skipping solar altogether, produces the better financial outcome. Oversizing a system for a low-usage household rarely produces the same return as matching production closely to actual consumption, which is exactly why solar panels for low-electricity homes are usually sized down rather than skipped entirely.
A Straightforward Take on Solar Panels for Low-Electricity Homes
For genuinely low-usage households, the honest recommendation on solar panels for low-electricity homes is usually a smaller, carefully sized system rather than either a full-size array or no solar at all.
5 Reasons Why Solar Panels Are Not Worth It for Every Home
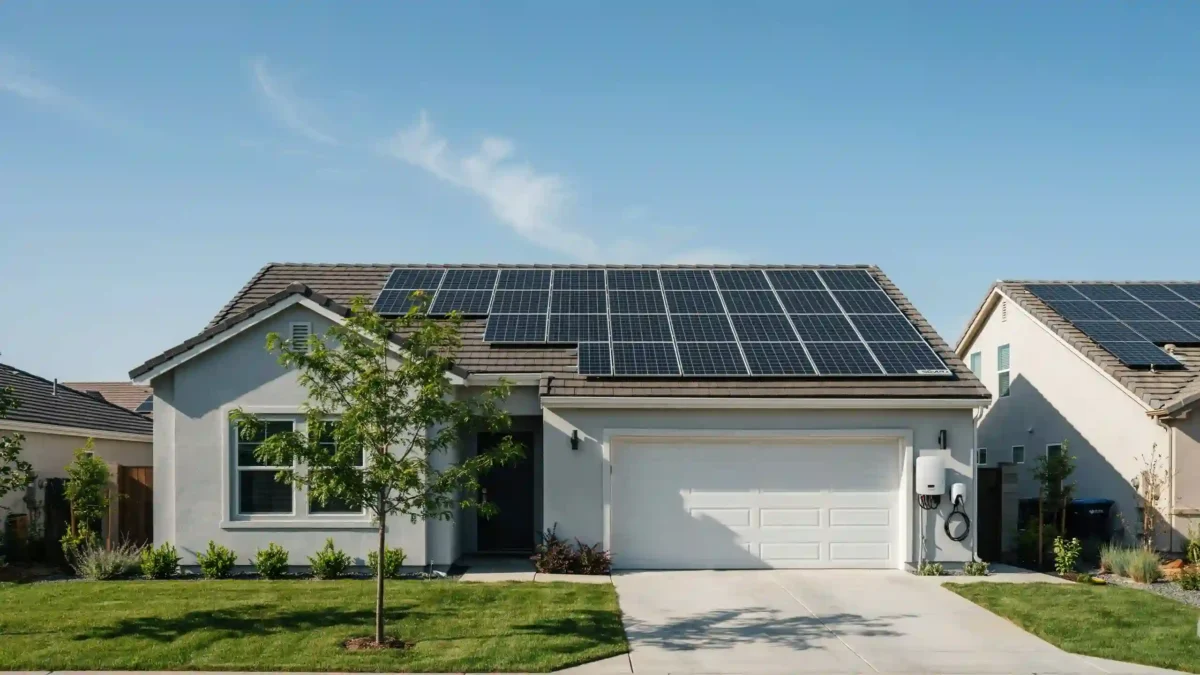
Solar makes sense for many households, but not universally, and 5 reasons why solar panels are not worth it for a given home address that directly rather than pretending every roof is a good candidate.
1. High Upfront Cost
The initial investment, along with any financing costs layered on top, can outweigh the benefit for a household that doesn’t expect to stay in the home long enough to recover it.
2. Poor Roof Conditions
A roof needing replacement soon complicates the project and adds cost, since panels typically need to come down and go back up around that work.
3. Heavy Shading
Trees and surrounding structures that block meaningful sunlight can reduce production enough to undermine the system’s economics regardless of how well everything else is sized.
4. Low Electricity Consumption
A household with genuinely low electricity use has less to offset in the first place, which caps the potential savings no matter how well the system is designed. Fourth on this list of 5 reasons why solar panels are not worth it, low usage alone rarely rules solar out completely, but it does call for a smaller system rather than a standard one.
5. Unfavorable Utility Compensation
Exported electricity compensation varies by location and can materially affect system economics; a household in a less favorable utility territory may see a longer return on investment than the same system elsewhere. This fifth item rounds out 5 reasons why solar panels are not worth it in certain specific circumstances, even though solar still works well for most households.
What 5 Reasons Why Solar Panels Are Not Worth It Have in Common
Contract and installation disputes are also a real risk worth knowing about, on top of the five reasons above; homeowners who feel misled by a sales pitch sometimes turn to resources like this overview of solar scams and consumer protection legal help, which is one more reason to vet an installer carefully before signing.
Reading 5 Reasons Why Solar Panels Are Not Worth It the Right Way
None of these five reasons means solar isn’t worth it broadly; each one just means the fit depends on the specific household and its specific roof, usage, and utility.
Adding Battery Storage to a Residential System
Homeowners add batteries for backup power, shifting self-generated electricity to later hours, increasing self-consumption, and taking advantage of time-of-use utility rates. Batteries add cost on top of the panels themselves, and their own warranty terms and usable capacity should be reviewed separately from the panel warranty. A battery is not automatically required for a grid-connected residential system to function.
Do You Need a Battery With Residential Solar?
A battery becomes more valuable in areas with frequent outages or strong time-of-use rate incentives. Outage protection and financial savings are two separate justifications for adding one, and a household should be clear on which one is actually driving the decision.
A Residential System and the Electric Grid
A grid-connected home system generates during the day, the household consumes some of that generation directly, and any excess either exports to the grid or, if a battery is present, gets stored for later. At night, or whenever the home needs more electricity than the system is producing, power is drawn back from the grid in the usual way.
What Happens When Solar Produces More Electricity Than the Home Uses?
Excess generation exports to the grid, and the applicable utility compensation determines its value; those rules vary meaningfully by utility and by state, so a national assumption rarely applies cleanly to a specific address. Interconnection disputes do occasionally arise at a much larger scale; this account of a transmission-level interconnection breach dispute involving TVA shows how seriously utilities and regulators treat interconnection agreements, even though a typical residential interconnection is a far simpler process.
What Happens When the Home Needs More Electricity Than Solar Produces?
In a grid-connected system, the shortfall is drawn from the grid automatically. A battery can change the timing of when stored electricity gets used, but it doesn’t change the basic difference between energy production over a day and the home’s instantaneous demand at any given moment.
How Long Does a Residential System Last?
Most residential equipment is built for a long service life, though panel output gradually declines over time through normal degradation. Inverters typically need replacement before the panels do, and any battery included in the system has its own, usually shorter, expected lifespan. Warranty period and actual physical service life are related but different concepts worth not confusing when comparing equipment.
Solar Panel Warranty and Performance
Coverage for a residential system typically includes a product warranty, a separate performance warranty, and workmanship coverage from the installer, each with its own terms and duration. For a closer look at what these overlapping warranties actually promise, this explanation of what a solar warranty typically covers breaks down the distinction between equipment failure and gradual performance decline.
Homeowners should keep this documentation on file, since it matters again at resale and in the rare event of an installation-related problem; injuries during installation, while uncommon, do happen, and this overview of solar installation injury claims is a reminder that installer safety practices and proper licensing are worth confirming upfront.
How to Decide Whether Solar Fits Your Home
A simple checklist can cut through most of the noise before requesting quotes.
Check Your Electricity Usage
Review twelve months of utility bills, determine annual kWh consumption, and identify the household’s major electricity loads before sizing anything.
Check Your Roof
Age, condition, orientation, shading, and available area all need a straightforward assessment, ideally from more than one installer.
Check Your Utility Rules
Interconnection requirements, export compensation, time-of-use rates, and any utility-specific programs all shape the real-world economics of a given system.
Compare the Actual System Economics
Installed cost, expected production, annual savings, available incentives, financing costs, ongoing maintenance, and expected system life all belong in the same comparison. For a deeper walkthrough of any single piece of this checklist, this complete residential solar guide can serve as a starting reference point before requesting quotes.
Financing rarely goes wrong on well-run residential projects, but on the much larger commercial side, guides to solar project debt workouts exist precisely because larger financed projects can run into trouble that a typical home purchase never approaches.
Frequently Asked Questions About Residential Solar
What are solar panels for home use?
They’re photovoltaic systems sized for a single household, converting sunlight into electricity for the home to use, store, or export to the grid.
How many solar panels does a typical home need?
It depends mainly on the home’s annual electricity use, not its square footage, along with panel wattage and local sun exposure.
How much does solar electricity for home use cost?
There’s no single nationwide number; total cost depends on system size, equipment, labor, and available incentives.
Are solar panels suitable for low-electricity homes?
Often yes, with a smaller system sized to match actual usage rather than a standard-size installation.
What is the difference between domestic solar panels and commercial solar panels?
Domestic systems are sized for a single household’s electrical service, while commercial and utility-scale systems involve larger equipment and different financing and legal structures.
Can solar panels provide all of a home’s electricity?
They can offset all of a home’s annual usage on paper, but real-time consumption at night or during low production still typically draws from the grid unless a battery is included.
Do residential solar panels need a battery?
No. A grid-connected system works without one; a battery adds backup power and more control over when stored electricity gets used.
How long do residential solar panels last?
Panels are generally built for decades of service with gradual output decline, though inverters and batteries usually need replacement sooner.
Can solar panels be installed on any house?
Not automatically. Roof condition, structure, shading, and orientation all need a site-specific assessment first.
What are the main reasons solar panels may not be suitable for a home?
High upfront cost, poor roof condition, heavy shading, low electricity consumption, and unfavorable utility compensation are the most common reasons.
This article by SolarInfoPath (2026 research framework) is part of a comprehensive solar knowledge architecture covering all major high-value sectors including legal disputes (installation negligence, contracts, liability, fraud, lawsuits, liens, HOA and permitting disputes), financial structures (loans, PPA/lease agreements, DSCR financing, tax equity, investment and project finance), tax law (ITC, Section 48/25D, MACRS depreciation, bonus credits, IRS audits, recapture rules, domestic content and IRA/OBBBA compliance), insurance and risk (property damage, hail/wind/fire claims, bad faith insurance disputes, warranty coverage), policy and regulation (net metering, FERC interconnection, state utility rules, incentive programs and regulatory changes), commercial and utility-scale development (EPC contracts, construction delays, performance bonds, receivership, bankruptcy, asset sale and restructuring), real estate impacts (home value, solar leases, liens, title issues, HOA restrictions, easements), and emerging market structures such as battery storage, community solar, agrivoltaics, SRECs, yieldcos, and institutional investment funds. All content is based on publicly available regulatory, financial, and legal sources and is intended strictly for educational and informational purposes, not legal, tax, or financial advice. Readers should always verify current laws, utility policies, tax regulations, and contract terms with qualified licensed professionals before making decisions, as solar regulations, incentives, and financial structures frequently change across jurisdictions and time.

Solar Legal Analyst· Policy Researcher· Investigative Finance Writer Lead Analyst & Founder of SolarInfoPath
Morgan Lee is a solar legal analyst, policy researcher, and investigative finance writer with 12+ years of experience in U.S. renewable energy law, IRS tax credit compliance, and solar litigation. He is the founder of SolarInfoPath, a research-driven platform focused on primary-source analysis of solar contracts, tax law, regulatory policy, and industry disputes affecting homeowners and commercial developers.
His work is grounded in original legal and regulatory sources, including IRS notices, FERC and CPUC rulings, state court filings, PACER records, and UCC lien databases. He specializes in solar contract disputes, injury and workers’ compensation claims, PACE financing issues, tax equity structures, ITC recapture rules, MACRS depreciation, and federal and state solar policy frameworks.
Morgan’s analysis spans solar litigation, finance structures, and regulatory developments such as the IRA and OBBBA, interconnection reform, domestic content rules, and battery storage incentives. He also covers EPC contracts, PPAs, project financing, and utility-scale solar investment structures.