
Tesla solar panels deliver 400–460W output with 19.3%–22.5% efficiency and qualify for the 30% federal Residential Clean Energy Credit. A standard 8 kW residential system costs $21,920–$26,400 before incentives.
After the ITC, most homeowners pay $15,344–$18,480. Whether that investment makes sense depends heavily on your utility rate, roof orientation, and local net metering terms, not just the panel specs Tesla advertises.
Most homeowners who start researching Tesla solar panels have already sat through at least one sales presentation. They’ve heard the pitch about energy independence, $0 electric bills, and a system that “pays for itself.”
What they haven’t heard, and what no installer ever volunteers, is the full picture: what the panels actually cost after every soft charge, how the installation timeline really plays out, and where the numbers stop matching the projections.
This guide covers all of it. Not to scare you away from solar, and not to sell you on it either. The goal here is to give you the second opinion that the sales process never provides.
What Are Tesla Solar Panels and How Do They Work?
Tesla solar panels are monocrystalline photovoltaic (PV) systems designed for residential rooftops. They convert sunlight into usable electricity through a three-stage process: the panels generate DC power, an inverter converts it to AC, and your home draws from that converted power before pulling anything from the grid.
How Photovoltaic Cells Convert Sunlight to Electricity
Each Tesla panel contains monocrystalline silicon cells that release electrons when photons from sunlight strike them. That movement of electrons is direct current (DC) electricity. At the panel level, individual cells are wired together to produce 400–460W of power output per panel, depending on the model and light conditions.
One thing most explanations skip: panel efficiency rating doesn’t tell you how much electricity your home will actually produce. It tells you how well the panel converts available sunlight per square foot of surface.
Tesla’s 19.3%–22.5% efficiency range is competitive, but your real-world output depends on your roof’s orientation, the angle of the sun in your region, seasonal shading, and how hot your roof gets, which brings us to the temperature coefficient, covered below.
The Role of the Solar Inverter in Your Home Energy System
The solar inverter converts DC electricity from your panels into the 120V/240V AC power your home uses. Tesla uses string inverters with a rated efficiency of 97.5%–98%, which means roughly 2–2.5% of the electricity generated at the panel level is lost in conversion before it reaches your outlets.
That loss sounds small. Over a year on an 8 kW system producing ~10,000 kWh, it represents 200–250 kWh of electricity you generated but couldn’t use. At a national average of $0.17/kWh, that’s $34–$42 annually. Not a dealbreaker, but worth understanding when evaluating long-term output claims.
String inverters differ from microinverters in one key way: every panel in the string is limited by the lowest-performing panel. If one panel is partially shaded, every panel connected to it produces at a reduced rate. Tesla addresses this through power zones, a shade mitigation design built into the panel itself.
How Tesla’s Integrated Ecosystem Connects Panels, Battery, and App
Tesla’s system is built as an interconnected energy ecosystem: the panels generate power, the Powerwall 3 stores it, the inverter manages conversion, and the Tesla app tracks everything in real time. All components are designed to communicate with each other natively, which reduces compatibility issues that can occur with third-party equipment combinations.
The integration benefit is real, but it also means you’re locked into Tesla’s ecosystem. If a Powerwall goes out of production or the app changes, your system’s smart features depend on Tesla continuing to support that infrastructure. That’s not a reason to avoid the system; it’s a question worth asking before you sign anything.
Tesla Solar Panel Specs and Performance (2026)
Tesla’s 2026 panel lineup delivers 400–460W output with an all-black monocrystalline design. Efficiency lands at 19.3%–22.5% depending on system configuration. The 25-year performance warranty guarantees minimum output retention, and the temperature coefficient determines how much efficiency you lose on hot days.
Power Output, Efficiency, and Temperature Coefficient Explained
Power output, measured in watts (W), tells you how much electricity a panel produces under ideal lab conditions (1,000 W/m² of sunlight, 25°C panel temperature). Tesla’s 400–460W range is what you’d see on a clear day with direct sun and a cool roof.
The temperature coefficient is what matters on hot summer days. Tesla’s coefficient runs around -0.30% per °C above 25°C. If your roof surface reaches 55°C, which is common in Sun Belt states during July, each panel is already losing 9% of its rated output before any shading factor is considered. A 440W panel becomes a ~400W panel in real-world summer heat.
This isn’t a Tesla-specific problem. It’s a physics problem that affects every panel brand. But it’s a number the sales process rarely mentions.
Tesla Solar Panels vs. Top Competing Brands
Efficiency Comparison Table: Tesla vs. Premium Panels
| Brand | Efficiency Range | Power Output | Temp Coefficient | 25-Yr Warranty |
| Tesla | 19.3%–22.5% | 400–460W | ~-0.30%/°C | Yes |
| SunPower Maxeon | 22.0%–22.8% | 420–440W | -0.27%/°C | Yes |
| REC Alpha | 21.4%–22.3% | 405–430W | -0.26%/°C | Yes |
| Q CELLS Q.PEAK | 20.4%–21.4% | 395–415W | -0.34%/°C | Yes |
| Canadian Solar | 19.5%–21.2% | 390–430W | -0.34%/°C | Yes |
Tesla is competitive across this field but not dominant in any single metric. Where it pulls ahead is ecosystem integration; no competing brand offers native battery and EV charger compatibility at the same level. Where it falls short is in independent installer availability, which affects your ability to get competitive bids.
What Is Panel Degradation Rate and Why Does It Matter?
Panel degradation rate is the single most important long-term performance number that most homeowners never ask about. Tesla’s panels degrade at approximately 0.5% per year. That means by year 25, a panel producing 440W today is producing roughly 385W.
Here’s the math on what that actually costs you:
A system generating 12,000 kWh in year one will generate approximately 10,500 kWh in year 25 at a 0.5% annual degradation rate. At $0.17/kWh, that’s a $255 annual difference in generation value.
The 25-year performance warranty guarantees a minimum of 80–87% of rated output, which aligns with this trajectory, but it doesn’t compensate you for the energy you lose in the later years. It only covers you if degradation is worse than the warranty threshold.
Shade Tolerance: How Power Zones Protect Your Output
Tesla’s shade mitigation design divides each panel into independent power zones. When one section is shaded by a chimney, a tree, or a neighboring roofline during certain hours, the unshaded zones continue operating at full output rather than being dragged down by the shaded section.
This matters most for homes with complex rooflines or east/west-facing panels. If your roof is a clean south-facing plane with no obstructions, shade mitigation provides minimal benefit. If your roof has multiple angles, dormers, or anything casting shadows during peak hours, power zones can meaningfully improve your annual output.
How Much Do Tesla Solar Panels Cost in 2026?
A Tesla solar installation in 2026 costs approximately $2.74–$3.30 per watt before incentives, based on DOE benchmark data. For most residential systems, that places total costs are between $10,960 for a 4 kW system and $52,800 for a 16 kW system before the federal tax credit reduces the net price by 30%.
Average Cost Per Watt and Total System Price by Size
Estimated Costs for 4 kW, 8 kW, 12 kW, and 16 kW Systems
| System Size | Pre-Incentive Cost (Low) | Pre-Incentive Cost (High) | After 30% ITC (Low) | After 30% ITC (High) |
| 4 kW | $10,960 | $13,200 | $7,672 | $9,240 |
| 8 kW | $21,920 | $26,400 | $15,344 | $18,480 |
| 12 kW | $32,880 | $39,600 | $23,016 | $27,720 |
| 16 kW | $43,840 | $52,800 | $30,688 | $36,960 |
Estimates based on $2.74–$3.30/watt DOE benchmark. Individual quotes vary by location, roof complexity, and permit requirements.
One detail worth noting: Tesla’s pricing is set nationally and displayed online before you speak to anyone. That’s genuinely different from most solar companies, which require a sales call before disclosing any number. The transparency is useful, but it also means the price reflects a standardized system design, not your specific roof.
What Drives the Price? Breaking Down Hardware, Labor, and Soft Costs
According to DOE benchmark data, residential solar costs break down roughly as:
- Hardware (panels, inverter, mounting): ~43% of total cost
- Labor (installation crew): ~7% of total cost
- Design, engineering, permitting overhead: ~28% of total cost
- Installer margin and overhead: remaining ~22%
That 28% soft cost number surprises most homeowners. It means more than a quarter of what you pay never physically touches your roof. It covers the permit application process, utility interconnection filings, engineering sign-off, and administrative coordination, all of which Tesla handles in-house, which is part of why their pricing is consistent.
If you’re comparing Tesla’s quote to a local installer, compare total costs, not just panel prices. A local installer quoting higher-efficiency panels at a lower per-watt price may carry the same or higher soft costs underneath.
Does Tesla Offer a Price-Match Guarantee?
Tesla does offer a price-match guarantee on comparable solar systems. The conditions matter: the competing quote must be for a system of equivalent size and specifications, and Tesla must verify the comparison. In practice, this protects you from the most dramatic pricing gaps, but it doesn’t mean Tesla will automatically be your lowest-cost option after accounting for all variables.
Here’s where most people run into problems: Tesla’s price-match applies to the system, not to the incentives, financing structure, or post-installation support terms. Make sure you’re comparing total financial outcomes, not just the sticker price per watt.
Adding Battery Storage: How It Affects Your Total Cost
Adding a Powerwall 3 increases your total system cost by approximately $9,200–$11,500, depending on installation complexity. For homes in areas with frequent outages or utilities that have reduced net metering rates, storage often makes financial sense.
For homes with full retail net metering and reliable grid power, the battery’s payback math is harder to justify on economics alone, though many homeowners value the backup function independent of strict ROI.
The Powerwall 3 does qualify for the 30% federal ITC when installed with solar panels, which meaningfully reduces the net cost. Installed standalone without solar, battery-only ITC eligibility follows different rules, covered in the tax credit section below.
Tesla Solar Roof Cost: Is It Worth It vs. Standard Panels?
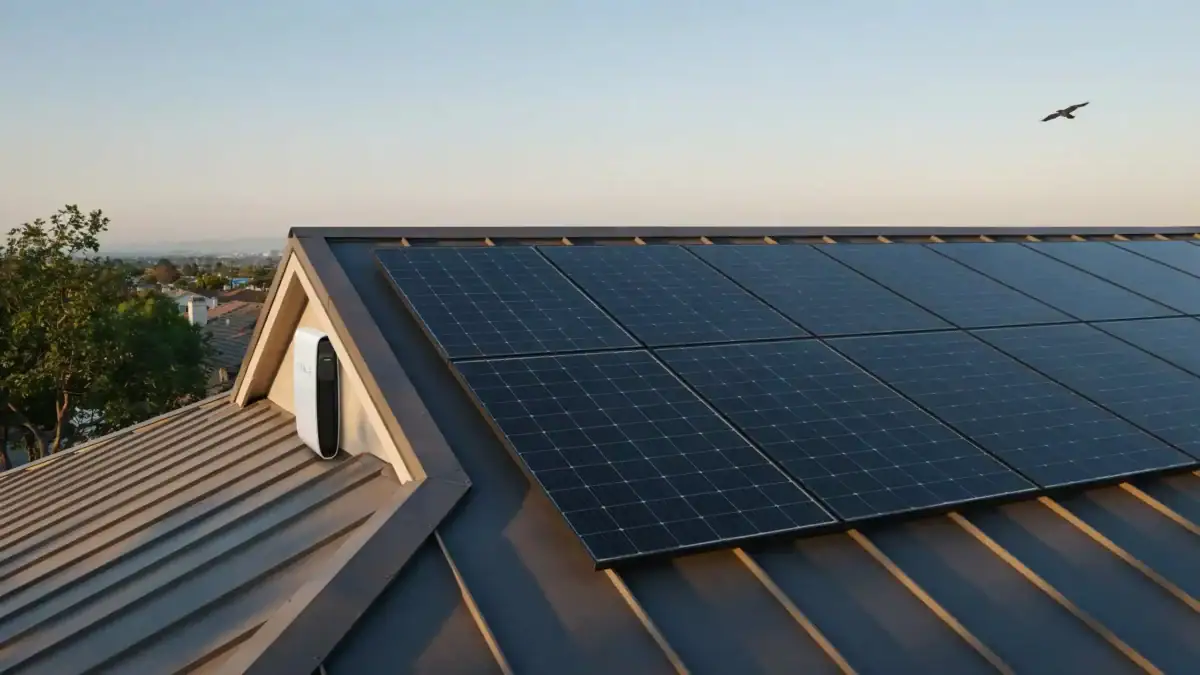
The Tesla Solar Roof costs $35,000–$70,000+, depending on roof size and complexity, compared to $15,000–$40,000 for standard Tesla panels on the same home. For most homeowners, the Solar Roof is not the financially optimal choice, but for specific situations, the premium is justified.
What Is the Tesla Solar Roof and Who Is It For?
The Tesla Solar Roof replaces your existing roof entirely with solar shingles, solar tiles that function as both roofing material and photovoltaic panels. The power output per square foot is lower than that of traditional panels, and the installed cost per watt is significantly higher.
Tesla Solar Roof is built for a specific homeowner: someone who needs a full roof replacement anyway, has strong aesthetic preferences against traditional panel profiles, and lives in a high-electricity-rate area where the premium cost can be partially absorbed by higher lifetime savings.
Solar Roof vs. Solar Panels: Cost, Performance, and Aesthetics Compared
| Factor | Tesla Solar Roof | Tesla Solar Panels |
| Installed cost | $35,000–$70,000+ | $15,000–$40,000 |
| Cost per watt | $5.50–$7.00+ | $2.74–$3.30 |
| Efficiency | Lower (tile design limits cell area) | 19.3%–22.5% |
| Aesthetic | Seamless roofline integration | Visible panel profile |
| Best case for | Full roof replacement + solar | Roof in good condition |
| Payback period | Longer (15–25+ years) | 6–12 years |
When Does a Solar Roof Make More Financial Sense?
If your existing roof needs full replacement within the next 3–5 years, the Solar Roof comparison changes. You’re no longer choosing between “panels plus nothing” versus “Solar Roof.” You’re choosing between “panels plus a new conventional roof” versus “Solar Roof.” In that scenario, the cost gap narrows, sometimes significantly.
A homeowner in Phoenix paying $280/month to APS, facing a full reroof on a 2,800-square-foot home, might find the Solar Roof’s combined cost falls within $8,000–$12,000 of panels-plus-conventional-roof.
In a high-sun market with strong electricity rates, that gap can close to near break-even over a 20-year window. But it requires an honest accounting of both replacement costs, not just the solar comparison.
Tesla Powerwall 3: Battery Storage Explained
The Powerwall 3 stores 13.5 kWh of usable energy, delivers up to 11.5 kW continuous power output, and carries a 10-year warranty. It integrates natively with Tesla solar panels and supports grid outage protection, time-of-use optimization, and EV charging.
How the Powerwall Works With Your Solar Panels
During daylight hours, your Tesla solar panels generate electricity. Your home uses what it needs in real time. Excess generation, power your home doesn’t immediately consume, flows into the Powerwall rather than back to the grid. At night, or during a grid outage, the Powerwall discharges to power your home without drawing from the grid.
The financial value of this cycle depends entirely on your utility’s rate structure. In states with time-of-use (TOU) pricing, where grid electricity costs 2–3x more during evening peak hours than midday, storing your solar generation and discharging it during peaks is genuinely valuable. In states with flat-rate billing, the Powerwall’s financial case rests primarily on backup protection, not daily savings arbitrage.
Powerwall 3 Specs: Capacity, Power Output, and Warranty
- Usable energy capacity: 13.5 kWh
- Continuous power output: 11.5 kW
- Peak power output: 22 kW (10 seconds)
- Round-trip efficiency: ~90%
- Warranty: 10 years / 70% capacity retention
- Weight: ~287 lbs (professional installation required)
The 90% round-trip efficiency means that for every 10 kWh you store, 9 kWh comes back out. The 1 kWh loss per cycle is real but manageable, it represents roughly $0.17 in lost value per cycle at average rates.
Time-Based Control Mode and Storm Watch: Smart Features Explained
Time-based control mode automatically manages when the Powerwall charges and discharges based on your utility’s rate schedule. You program your utility’s TOU windows, and the system charges during cheap off-peak hours (or from solar) and discharges during expensive peak hours.
Storm Watch monitors National Weather Service alerts. When severe weather is forecast for your area, the Powerwall automatically maximizes its charge level in advance, even if that means pulling power from the grid at non-peak rates, to ensure you enter the storm with a full battery.
Both features work through the Tesla app. One realistic limitation: Storm Watch requires a live internet connection to receive NWS data. During extended outages where your home internet also goes down, the Powerwall continues operating on its last programmed settings, but Storm Watch cannot update or respond to new forecasts.
How Much Does the Powerwall 3 Cost and Is It Worth It?
The Powerwall 3 costs approximately $9,200–$11,500 installed. After the 30% ITC when bundled with solar, the net cost drops to approximately $6,440–$8,050.
The financial case is strongest when:
- Your utility has TOU pricing with a peak-to-off-peak rate spread of $0.10/kWh or more
- Your area experiences regular grid outages (more than 2–3 per year)
- Your net metering rate has been reduced below retail, meaning the grid pays you less than you pay for grid power
For a homeowner in California paying Pacific Gas & Electric rates, where peak rates can reach $0.45–$0.55/kWh and TOU pricing is standard, one Powerwall discharging 10 kWh daily during peak hours represents roughly $1,460–$2,000 in annual rate arbitrage, bringing payback to 3–5 years. That math doesn’t exist in states with flat-rate billing at $0.12/kWh.
Tesla Solar Tax Credit 2026: How to Maximize Your Savings
The federal Residential Clean Energy Credit allows homeowners to deduct 30% of qualified solar system costs from their federal income tax liability, dollar for dollar, not as a deduction. For a $25,000 Tesla system, that’s a $7,500 direct reduction in what you owe the IRS. This credit remains at 30% through 2032 under the Inflation Reduction Act.
The 30% Federal Residential Clean Energy Credit Explained
The Investment Tax Credit (ITC) is not a rebate or a check. It reduces your federal tax bill by 30% of your total qualified system cost in the year your system receives Permission to Operate (PTO). If your tax liability in that year is less than the full credit amount, the unused portion carries forward to the following tax year.
The basis reduction rule is something almost no installer explains at the sales stage. When you claim the ITC, your tax basis in the solar system is reduced by 50% of the credit amount for depreciation purposes. For most residential homeowners who aren’t depreciating the system, this doesn’t create a direct financial impact.
But it matters if you ever sell the home and attempt to include the full system cost in your capital improvements documentation. It’s also worth understanding if you’re a self-employed homeowner who uses any portion of the home for business.
Per IRS Form 5695, the credit applies to the year the system is placed in service — which means the PTO date, not the installation date. If your installation completes in December but the utility doesn’t issue PTO until January, your credit shifts to the following tax year.
Which Tesla Products Qualify for the ITC?
Solar Panels vs. Battery Storage: Tax Credit Eligibility Rules
| Product | Qualifies for 30% ITC? | Condition |
| Tesla Solar Panels | Yes | Must be installed on the primary or secondary residence |
| Tesla Powerwall 3 (with solar) | Yes | Must be charged primarily by solar (≥ 3 kWh capacity requirement met) |
| Tesla Powerwall 3 (standalone) | Yes | Standalone battery storage qualifies under IRA 2022 rules |
| Tesla Solar Roof (active tiles only) | Yes | Only the solar-generating tile portions — not the non-generating tiles |
| Tesla Wall Connector (EV charger) | No | EV charging equipment uses a separate credit (Section 30C), not the ITC |
The Solar Roof tax credit nuance is worth explaining carefully: only the portion of your Solar Roof that generates electricity qualifies for the ITC.
Tesla calculates this split during the design process and provides documentation for your tax filing. Non-generating tiles, used to cover areas of the roof that don’t face suitable directions for solar, are treated as standard roofing material for tax purposes.
State Solar Tax Credits, Rebates, and Net Metering Programs
State incentives vary significantly. Some states layer multiple programs, a property tax exemption on the system’s added home value, a sales tax exemption on the hardware purchase, state rebates, and net metering credits on top of the federal ITC.
Others offer one or two programs, and a few offer nothing meaningful beyond what the federal government provides.
- Net metering (NEM) credits your electric bill for excess generation sent to the grid. How much you’re credited per kWh, and whether you get the retail rate or a reduced “avoided cost” rate, varies by utility and state regulation.
- Solar Renewable Energy Credits (SRECs) allow you to sell certificates representing 1,000 kWh of solar generation to utilities in states with active SREC markets. States like New Jersey, Maryland, and Pennsylvania have historically supported active SREC markets. Not all states offer them.
- Property tax exemptions prevent the assessed value increase from your solar installation from raising your property tax bill.
For verified current state incentive data by state, the DSIRE database at the National Renewable Energy Laboratory is the most reliable source available.
Solar Renewable Energy Credits (SRECs): Can You Earn From Your System?
SRECs represent one of the least-understood income streams in residential solar. In active SREC markets, your system generates one certificate for every 1,000 kWh produced. Those certificates can be sold on state-specific markets to utilities that need to meet renewable portfolio standards.
The catch: SREC values are market-driven and volatile. A certificate worth $250 in one year may be worth $40 two years later as more solar supply enters the market. Anyone projecting SREC income into a 10-year savings estimate is projecting something genuinely unpredictable. Include it as upside, not as a baseline.
How to Calculate Your Net Cost After All Incentives
Here’s a straightforward calculation framework for an 8 kW Tesla system:
- Gross system cost: $24,000
- Federal ITC (30%): -$7,200
- State rebate (if applicable): varies — use DSIRE for your state
- Net cost before financing: $16,800
- If financing: add dealer fee (typically 10–20% of loan principal) to true cost
- Estimated annual savings (at $0.17/kWh, 10,000 kWh/year): ~$1,700
- Simple payback at net cost: $16,800 ÷ $1,700 = ~9.9 years
That’s a base calculation. Your real number shifts with your actual utility rate, your net metering credit rate, and whether any state rebates apply. At $0.24/kWh (California rates), that same system saves ~$2,400/year — pushing payback to 7 years.
Tesla Solar Installation Process: What to Expect Step by Step
Tesla’s installation process runs in five stages from online quote to Permission to Operate. The physical installation typically takes 1–2 days. The full timeline from quote to powering on runs 2–5 months in most markets, with permitting as the primary variable.
Step 1 — Online Quote and Satellite Roof Design
Tesla’s online quote process uses satellite imagery to analyze your roof. You enter your address and monthly electricity bill, and the system generates a preliminary system size recommendation and estimated cost, without a sales call.
What the satellite design gets right: roof dimensions, cardinal orientation, and approximate shading from nearby structures. What it gets wrong: roof condition (which affects installation complexity), minor obstructions not visible in satellite imagery, and structural factors that may require additional engineering.
The satellite quote is a starting point. It should not be treated as a final price.
Step 2 — Site Assessment and Final System Design
After you place a deposit (refundable within Tesla’s cancellation window), a Tesla representative conducts a site assessment. This is the stage where the satellite design gets validated against your actual roof, electrical panel, and structural conditions.
This is also where additional costs surface, such as main panel upgrades if your existing electrical panel can’t support the new system. Panel upgrades typically run $1,500–$3,000 and are common in homes older than 20 years with 100A service. They’re rarely mentioned in the initial quote.
For solar permit requirements and what to expect during utility review, the specifics vary by municipality, which directly affects your timeline.
Step 3 — Permitting: The Longest Part of the Timeline
Permitting is the stage that consistently catches homeowners off guard. Tesla handles the permit applications, engineering drawings, and utility interconnection filings, but it cannot control how long the local jurisdiction takes to review and approve them.
In major metro areas with high solar adoption, permit queues can run 6–12 weeks. In rural areas or municipalities with limited solar experience, it can take longer. Some jurisdictions have streamlined solar permitting; others still require manual review of full engineering packages.
The interconnection application to your utility, separate from the building permit, adds another layer. Grid interconnection queues have grown as solar adoption has increased. In some California utility territories, interconnection queues for small residential systems now run 8–14 weeks on their own. Your installer is largely at the mercy of these timelines.
Step 4 — Physical Installation Day
The physical installation of most residential Tesla systems takes 1–2 days. Tesla uses a combination of in-house crews and vetted subcontractors, depending on your market.
The in-house vs. subcontractor distinction matters for one specific reason: accountability. If something goes wrong during installation, a roof penetration that later leaks, wiring that doesn’t pass inspection, knowing whether your installer was a direct Tesla employee or a subcontractor affects how warranty claims and repair responsibility are handled.
For what’s covered under warranty when installation damage occurs, Tesla’s workmanship warranty terms explain coverage scope and how to file claims.
Step 5 — Inspection, PTO, and Powering On
After physical installation, the system must pass a local inspection before the utility grants Permission to operate. This is a non-negotiable step; you cannot legally operate your system until PTO is issued. Doing so voids your warranty and potentially your net metering agreement.
The inspection schedules through your local building department, not Tesla. In some markets, inspections are scheduled within days. In others, the backlog extends weeks. Tesla handles coordination, but timing is outside anyone’s direct control.
Once PTO is granted, Tesla activates your system remotely. From that date forward, your system is generating power, and your tax credit clock starts.
How Long Does Tesla Solar Installation Take in 2026?
| Stage | Typical Duration |
| Quote to deposit | 1–3 days |
| Site assessment | 1–2 weeks after deposit |
| Design finalization | 1–2 weeks |
| Permitting | 4–14 weeks (variable by location) |
| Physical installation | 1–2 days |
| Inspection and PTO | 2–6 weeks after installation |
| Total: quote to PTO | 2–5 months |
Plan for the longer end of this range if you’re in a high-volume solar market, installing in late spring or summer when demand peaks, or working with a municipality that has a manual permitting review process.
In-House Crews vs. Subcontractors: What You Need to Know
Tesla uses both in-house installation crews and third-party subcontractors. In markets where Tesla has established a direct workforce, in-house installation is more common. In newer markets or during high-volume periods, subcontractors handle more of the work.
The practical difference: in-house crews are trained directly to Tesla’s standards and operate under Tesla’s direct quality control. Subcontractors are vetted, but their work quality can vary. Before installation, ask your Tesla representative whether your installation will use an in-house crew or a subcontractor, and note the answer in writing.
Tesla Solar Warranty: What’s Covered and What’s Not
Tesla’s 2026 warranty package covers panel performance for 25 years, workmanship for a separate period, and the Powerwall under its own 10-year terms. Understanding what each warranty does and doesn’t cover is one of the most important due diligence steps before signing.
25-Year Panel Performance Warranty Explained
Tesla’s 25-year performance warranty guarantees that panels will retain at a minimum 80–87% of their originally rated power output at the end of 25 years. The warranty degrades in steps, not linearly- and the specific thresholds are documented in the warranty agreement.
What the warranty covers: panel output that falls below the guaranteed threshold at any point during the 25-year term. Tesla will repair or replace panels that underperform the warranted level.
What the warranty does not cover: the normal degradation within the guaranteed range. If your panels degrade from 440W to 385W by year 25, which is consistent with a 0.5% annual degradation rate, that’s within the warranty terms.
The warranty only triggers if degradation is worse than 80–87%, not because your panels are producing less than they were on day one.
Comprehensive Workmanship Warranty: Duration and Coverage
Tesla’s workmanship warranty covers defects in installation, improper mounting, wiring errors, and roof penetration issues, for a defined period after installation. This is separate from the manufacturer’s panel warranty and the Powerwall warranty.
The coverage you most want to verify: roof penetration protection. Solar mounting systems penetrate your roof dozens of times. If those penetrations aren’t properly sealed and flashed, you face a leak risk.
Tesla’s workmanship warranty covers leaks caused by installation defects. Understanding the claims process before you need it is worth reviewing what a solar warranty actually covers in detail.
How Tesla’s Warranty Compares to Industry Standards
| Warranty Type | Tesla | Industry Standard |
| Panel performance | 25 years (80–87% output) | 25 years (80% output) |
| Workmanship/installation | Covered (verify current term) | 5–10 years typical |
| Powerwall battery | 10 years / 70% capacity | 10 years / 70% capacity |
| Inverter | Varies | 10–25 years, depending on brand |
Tesla’s warranty structure is competitive with the top tier of the industry. The area that matters most in practice is what happens when you need to make a claim, response time, repair process, and whether Tesla’s service capacity in your region can support timely resolution.
What Happens If Something Goes Wrong After Installation?
Tesla handles warranty claims through their app and customer service portal. Response times and resolution experiences vary by market and by the nature of the issue. Minor monitoring problems often resolve through remote diagnostics. Physical panel or mounting issues require a site visit and scheduling.
One realistic scenario homeowners face: if Tesla significantly changes its service model, is acquired, or exits a market, warranty obligations transfer to the acquiring entity, but the practical support infrastructure may change.
This isn’t a reason to avoid the product; it’s a risk any homeowner should weigh when choosing a company that will theoretically service your home for 25 years.
Tesla Solar Panels Worth It in 2026? Honest Pros and Cons
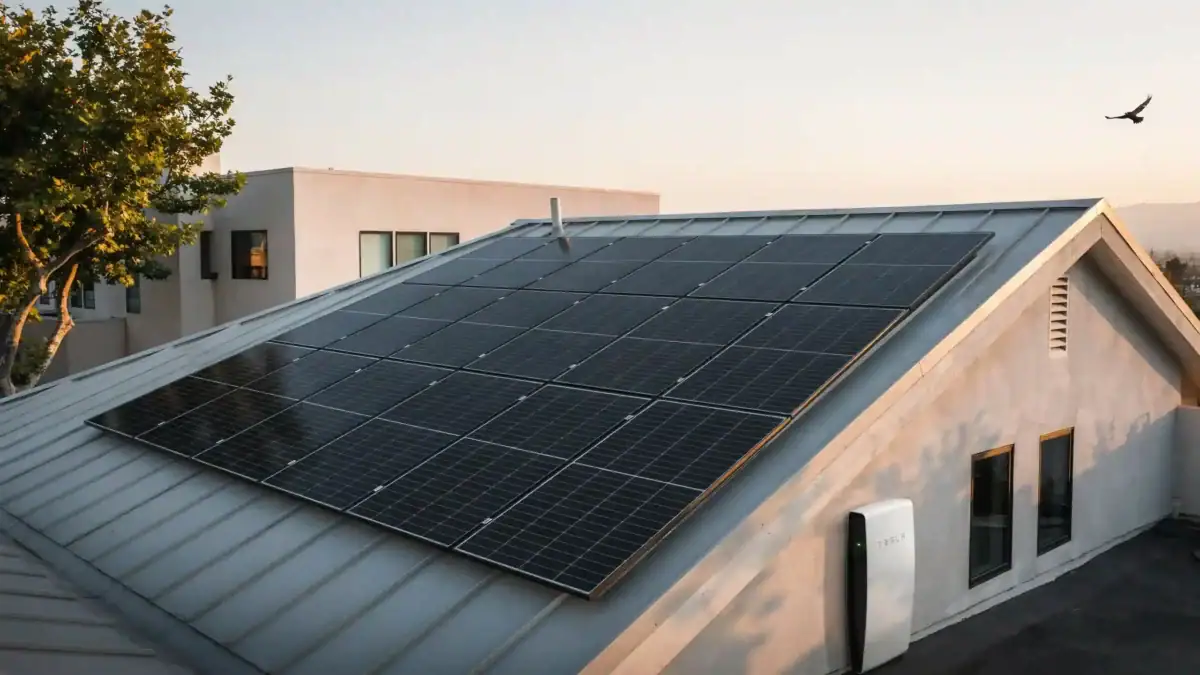
Whether Tesla solar panels are worth it depends on your electricity rate, roof conditions, financing method, and state policy environment, not on the brand name. Here’s an honest assessment of where Tesla excels and where it falls short.
Where Tesla Solar Excels
- Integrated ecosystem: panels, battery, and EV charging work natively together, no third-party compatibility issues
- Transparent online pricing: you see costs before speaking to anyone, which is genuinely rare in this industry
- All-black aesthetic: low-profile monocrystalline design for homeowners who prioritize appearance
- Storm Watch and smart battery management: features that add real value in outage-prone or TOU-heavy markets
- Strong monitoring: the Tesla app provides production, consumption, and battery data in a single interface
Where Tesla Solar Falls Short
- No lease or PPA options: Tesla does not offer solar leases or power purchase agreements in 2026. Every installation is either a cash purchase or a financed loan, which means you need adequate tax liability to fully benefit from the ITC and sufficient credit for loan qualification.
- Subcontractor variability: not every installation is performed by direct Tesla staff, and quality can be inconsistent
- Customer service reports: Tesla’s solar customer service has historically been a pain point, particularly for scheduling follow-up visits after installation
- Limited competitive bidding: buying Tesla solar means buying Tesla solar. You can’t take that design and get three bids from different installers
Who Should Choose Tesla Solar?
Tesla is a strong fit for homeowners who:
- Want panel, battery, and EV integration in a single system with one warranty contract
- Are you making a cash purchase or have a strong federal tax liability to fully capture the ITC
- Place high value on aesthetics and want a flush, all-black roofline profile
- Live in a market where Tesla has an established service presence
Who Might Be Better Served by a Different Installer?
Consider alternatives if you:
- Want to compare bids from multiple installers using the same equipment
- Have limited federal tax liability (the ITC may not benefit you fully)
- Need a solar lease or PPA because you can’t afford the upfront cost or loan structure
- Have had negative experiences with Tesla’s customer service in previous product categories
For homeowners weighing whether a larger solar installation makes more economic sense, the financial structure of solar farms provides useful context on how commercial-scale economics differ from residential.
Calculating Your Solar Payback Period and Long-Term ROI
The solar payback period is the point where your cumulative energy savings equal your net out-of-pocket system cost. For most Tesla installations in 2026, that window runs 6–12 years depending on electricity rates, financing method, and state incentives.
What Factors Determine How Fast You Recoup Your Investment?
Five variables drive your payback period more than any panel spec:
- Your current electricity rate (cents per kWh)
- How much of your usage does the system actually offset
- Your net metering credit rate vs. retail rate
- Whether you paid cash or financed (loan interest adds to the true cost)
- Whether you have a full federal tax liability to claim the ITC
Average Payback Period: 6–12 Years Explained
The 6-year end of the range applies to homeowners in high-rate states (California, Hawaii, Massachusetts, Connecticut) who pay cash, claim the full ITC, and have favorable net metering. The 12-year end applies to homeowners in low-rate states who financed with high dealer fees and receive reduced net metering credits.
Here’s where most projections overstate performance: they assume today’s electricity rate stays flat for 25 years, or increases at a predictable rate. Real utility rates are set by regulatory proceedings, fuel costs, and grid infrastructure investment, none of which move predictably.
A 3% annual rate increase assumption may prove conservative or optimistic, depending on your utility.
Projections vs. Reality: Standard Sales Estimates vs. SolarInfoPath Analysis
| Metric | Standard Sales Estimate | SolarInfoPath Investigative Analysis |
| Annual savings on a $200/month bill | “$1,500–$2,400/year” | $1,200–$1,800/year after degradation, net metering credits at below-retail rates, and financing cost |
| Payback period (financed) | “7–8 years” | 9–13 years when dealer fee (15–20%) is included in the true cost |
| 25-year savings | “$40,000–$60,000” | $28,000–$45,000 after realistic degradation, variable net metering policy changes, and interest costs |
| Home value increases | “Up to 4%.” | ~3.5–4% in most markets; lower in low-rate states where buyers don’t value the system as highly |
| Utility rate increase assumption | “3–4% annually” | No basis for consistent projection; state regulatory cycles create step-change increases, not smooth curves |
How Solar Panels Increase Home Value and Speed Up Sale
Research consistently shows solar installations increase home resale value by approximately 4% and help homes sell roughly 20% faster than comparable non-solar properties.
These are averages, and like all averages, they hide significant variation. How solar panels affect home sale timelines varies by market, buyer demographics, and whether the system is owned outright or carries a transferable loan.
One thing worth knowing: a leased solar system (which Tesla doesn’t offer) can complicate a home sale, because the lease must be transferred to the buyer. Tesla’s loan-based systems are simpler to handle at closing, the system transfers as part of the home, and the buyer either assumes the loan or pays it off from sale proceeds.
25-Year Savings Projection: What to Realistically Expect
A realistic 25-year projection for an 8 kW system in a moderate-rate state ($0.17/kWh average):
- Year 1 annual generation: ~10,000 kWh
- Year 1 savings: ~$1,700
- Year 25 annual generation: ~8,750 kWh (0.5% annual degradation)
- Year 25 savings at flat rate: ~$1,488
- Cumulative 25-year savings (flat rate): approximately $39,700
That number rises meaningfully if electricity rates increase over 25 years. It falls if net metering policies change and you receive less than retail credit for excess generation. The honest answer is: $30,000–$45,000 over 25 years is a reasonable range for this scenario, not a guarantee.
Financing Your Tesla Solar System: Cash, Loan, or Lease?
Tesla offers two financing paths in 2026: cash purchase and solar loan. Leases and PPAs are not available. Each option carries different implications for tax credit eligibility, long-term cost, and home sale logistics.
Cash Purchase: Maximum Savings, Zero Interest
A cash purchase delivers the lowest total cost. You pay the gross system price, claim the 30% ITC on your federal return, and your electricity savings go directly to payback, no interest payments, reducing the return.
The practical barrier is obvious: $15,000–$40,000 is a significant liquidity event for most households. For homeowners who have the cash available and a strong federal tax liability, the math almost always favors cash over a loan.
Solar Loan: Own Your System With Monthly Payments
Solar loans allow you to own the system while spreading the cost over a term, typically 10–25 years. You still claim the full ITC. The system still adds to home value. The critical difference is the total cost.
Dealer fees are the hidden cost most homeowners miss. Solar loan products typically carry dealer fees of 10–20% of the loan principal. These fees are built into the loan structure and aren’t always disclosed as a line item.
A $24,000 system financed with a 15% dealer fee carries a true cost of $27,600 before interest. At 6.99% over 20 years, you’ll pay considerably more in total.
The practical workaround: some homeowners use the ITC refund, received the following spring as a tax credit, to make a large principal payment in year one, reducing the outstanding balance and significantly lowering total interest paid.
Why Leases and PPAs Are Not Available and What That Means for You
Tesla does not offer solar leases or power purchase agreements. This is a deliberate business model choice. For homeowners who cannot qualify for a loan or prefer not to own the system, it means Tesla is simply not an option, regardless of how much you like the product.
Leases and PPAs reduce upfront cost to near-zero, but the homeowner doesn’t own the system, doesn’t claim the ITC, and is locked into a long-term contract with a third-party owner. For homeowners who need this structure, Tesla’s competitors who offer it should be considered.
How Interest Rates and Dealer Fees Affect Your Total Loan Cost
| Loan Scenario | System Cost | Dealer Fee | Effective True Cost | 20-Year Total Paid |
| Cash purchase | $24,000 | None | $24,000 | $24,000 |
| Loan, 0% dealer fee, 6.99% | $24,000 | $0 | $24,000 | ~$36,100 |
| Loan, 15% dealer fee, 6.99% | $24,000 | $3,600 | $27,600 | ~$41,500 |
| Loan, 20% dealer fee, 6.99% | $24,000 | $4,800 | $28,800 | ~$43,300 |
If your monthly solar loan payment is close to your current electricity bill, the financial case for solar largely disappears; you’re trading one monthly payment for another. The financial value of solar ownership comes when your system is paid off, and the electricity savings continue for the remaining system life.
Tesla Solar Monitoring App: Tracking Your System’s Performance
The Tesla app provides real-time visibility into your solar system’s production, your home’s energy consumption, Powerwall charge level, and grid interaction — all from a single dashboard.
What the App Shows: Production, Consumption, and Battery Status
The home screen displays live energy flow in a visual layout: how much your panels are generating, how much your home is consuming, what the Powerwall is doing (charging or discharging), and whether you’re importing from or exporting to the grid.
Historical data allows you to review production by day, week, month, and year. This is where you’d first notice a performance issue, a panel or string producing significantly less than expected.
Most performance problems surface through the monitoring data before any visible symptom appears, which is why active monitoring during the first year is worth the few minutes it takes.
Customizing Backup Reserves and Energy Preferences
Through the app, you set your Powerwall’s backup reserve, the minimum charge level Tesla maintains at all times for outage protection. A 20% reserve on a 13.5 kWh Powerwall keeps 2.7 kWh available for emergencies at all times. A 50% reserve keeps 6.75 kWh held back.
Higher reserves mean less daily energy arbitrage but more outage protection. The right balance depends on your risk tolerance and how often your grid actually experiences outages.
If you’ve had three outages in the past year, a higher reserve makes sense. If you’ve had none in five years, you’re giving up daily savings for protection you’re unlikely to need.
App Availability and Desktop Monitoring Limitations
The Tesla app is available on iOS and Android. As of 2026, Tesla does not offer a full-featured desktop web portal for monitoring; the primary interface is mobile. For homeowners who prefer managing energy data on a desktop or want to export historical production data for spreadsheet analysis, this is a genuine limitation.
Some third-party integrations allow Tesla data to flow into home automation platforms like Home Assistant, but these require technical setup and are not officially supported by Tesla.
What to Honestly Expect Before You Sign
After studying Tesla’s solar program alongside real homeowner outcomes, the pattern I’ve seen most often is this: homeowners who do well with Tesla solar are the ones who entered the process informed.
They understood that permitting takes months, not weeks. They knew their net metering terms before they signed. They verified their federal tax liability before relying on the ITC as part of their payback calculation.
The homeowners who end up disappointed are usually not disappointed by the panels themselves. They’re disappointed by the gap between the projected savings and the actual bill, by a timeline that stretched longer than they expected, or by post-installation service that was harder to reach than the pre-sale process suggested.
Tesla solar panels are a genuine product with real performance credentials. The 30% ITC is a real financial benefit. The integrated ecosystem is a real advantage for households that will use it. None of that means solar is automatically the right decision for every home or every financial situation.
If your monthly electricity bill is under $100 and you’re in a state with modest sun exposure and reduced net metering, the payback math is genuinely difficult, regardless of which brand you choose. That’s not a discouraging conclusion; it’s an honest one, and it’s the kind of second opinion that’s worth having before you commit $25,000 or more.
For current federal solar incentive rules, the U.S. Department of Energy maintains updated guidance on the Residential Clean Energy Credit and related programs.
Frequently Asked Questions About Tesla Solar Panels
How efficient are Tesla solar panels?
Tesla solar panels achieve 19.3%–22.5% efficiency, which is competitive with the industry’s premium tier. Real-world output depends on your roof orientation, local sun hours, temperature, and shading conditions, not just the rated efficiency figure.
How long do Tesla solar panels last?
Tesla panels are built for a 25+ year lifespan with a performance warranty covering that full period. Physical degradation is gradual; most systems produce meaningful electricity well beyond 25 years, though output decreases each year at approximately 0.5%.
Are Tesla solar panels available in all 50 states?
Tesla Solar is available in most U.S. states, but service coverage and installer availability vary by market. In some rural areas, Tesla may not have established service infrastructure, which can affect installation timelines and post-installation support response.
Can I add a Powerwall to existing solar panels?
Yes, the Powerwall 3 can be added to an existing solar system, including systems originally installed by other companies, in many configurations. Compatibility depends on your existing inverter type and electrical setup. Tesla will assess compatibility during the site visit process.
What is the Tesla solar price-match guarantee?
Tesla’s price-match guarantee applies to comparable solar systems of equivalent size, specifications, and equipment. To claim it, you submit a competing quote for Tesla to review. The guarantee covers the system price but not financing structures, service terms, or incentive structures from the competing installer.
Does cleaning solar panels actually improve performance?
In areas with significant dust, pollen, or bird activity, cleaning can improve output by 2–5%. In regions with regular rainfall, panels largely self-clean. Whether cleaning is worth the effort depends on your local conditions and how your panels are mounted. Flat-mounted panels accumulate more debris than steeply pitched installations.
This article by SolarInfoPath (2026 research framework) is part of a comprehensive solar knowledge architecture covering all major high-value sectors including legal disputes (installation negligence, contracts, liability, fraud, lawsuits, liens, HOA and permitting disputes), financial structures (loans, PPA/lease agreements, DSCR financing, tax equity, investment and project finance), tax law (ITC, Section 48/25D, MACRS depreciation, bonus credits, IRS audits, recapture rules, domestic content and IRA/OBBBA compliance), insurance and risk (property damage, hail/wind/fire claims, bad faith insurance disputes, warranty coverage), policy and regulation (net metering, FERC interconnection, state utility rules, incentive programs and regulatory changes), commercial and utility-scale development (EPC contracts, construction delays, performance bonds, receivership, bankruptcy, asset sale and restructuring), real estate impacts (home value, solar leases, liens, title issues, HOA restrictions, easements), and emerging market structures such as battery storage, community solar, agrivoltaics, SRECs, yieldcos, and institutional investment funds. All content is based on publicly available regulatory, financial, and legal sources and is intended strictly for educational and informational purposes, not legal, tax, or financial advice. Readers should always verify current laws, utility policies, tax regulations, and contract terms with qualified licensed professionals before making decisions, as solar regulations, incentives, and financial structures frequently change across jurisdictions and time.

Solar Legal Analyst· Policy Researcher· Investigative Finance Writer Lead Analyst & Founder of SolarInfoPath
Morgan Lee is a solar legal analyst, policy researcher, and investigative finance writer with 12+ years of experience in U.S. renewable energy law, IRS tax credit compliance, and solar litigation. He is the founder of SolarInfoPath, a research-driven platform focused on primary-source analysis of solar contracts, tax law, regulatory policy, and industry disputes affecting homeowners and commercial developers.
His work is grounded in original legal and regulatory sources, including IRS notices, FERC and CPUC rulings, state court filings, PACER records, and UCC lien databases. He specializes in solar contract disputes, injury and workers’ compensation claims, PACE financing issues, tax equity structures, ITC recapture rules, MACRS depreciation, and federal and state solar policy frameworks.
Morgan’s analysis spans solar litigation, finance structures, and regulatory developments such as the IRA and OBBBA, interconnection reform, domestic content rules, and battery storage incentives. He also covers EPC contracts, PPAs, project financing, and utility-scale solar investment structures.