
A solar investment recovers its upfront cost over time, not all at once. This solar payback period guide measures the time it takes for cumulative solar savings to pay back that initial investment. The number changes with system price, electricity rates, annual production, incentives, export compensation, financing costs, and system degradation. Simple payback is different from broader measures like ROI. This guide focuses on U.S. residential solar.
What Is a Solar Panel Payback Period?
A solar panel payback period is the time it takes for electricity savings to equal the upfront cost of a solar system. It’s a direct relationship between what a system costs and what it saves each year. A shorter version of this number means the investment gets recovered sooner. That said, payback alone isn’t a complete measure of investment performance. It’s different from ROI, IRR, lifetime savings, cash flow, and net present value, each of which captures something payback doesn’t.
How the Calculation Works
The basic formula is simple: net upfront solar cost divided by annual solar savings equals the payback period. Each variable in that formula needs its own definition, covered below.
What Counts as Net Upfront Solar Cost?
System purchase price and installation costs make up most of this number. Applicable incentives and tax-related benefits reduce it. Financing fees count too, when they’re relevant to the calculation. Battery costs belong here only when the battery is part of the investment being analyzed. Roof condition can also add unexpected cost, and a resource like this look at whether solar panels cause roof damage is worth reading before assuming the roof itself won’t factor into the number.
What Counts as Annual Solar Savings?
Electricity the system offsets is the main component. The value of exported electricity and utility compensation both add to it. Changes in electricity rates shift the number over time. Other recurring costs can affect annual cash flow too.
How Long Does It Usually Take to Recover a Solar Investment?
There’s no single number that applies to every U.S. homeowner. System price, electricity rates, production, incentives, and financing all pull the estimate in different directions. A simple estimate and a full year-by-year cash-flow calculation can land on different numbers for the same system. Electricity-price increases can also change future savings substantially. A single national average tends to hide real state-level differences.
What’s the Average Payback Period for a Residential Solar System?
What’s the average payback period for a residential solar system is usually answered with a range, not one number. Treat any average as an estimate, not a guaranteed result. A meaningful average needs system cost, local electricity rates, production, and incentives all specified together. Cash purchases and financed projects should be kept separate, since financing changes the number.
What’s the Average Payback Period for a Residential Solar System, Really?
It depends most on which inputs get plugged in. Two homes with identical panels can land on very different numbers once local rates and incentives are applied. There’s no shortcut around plugging in a household’s own numbers.
A Straight Answer on Residential Averages
What’s the average payback period for a residential solar system worth remembering: treat every published average as a rough starting point, not a personal quote.
Why What’s the Average Payback Period for a Residential Solar System Matters
A wrong assumption here throws off every other financial projection built on top of it. Skipping this step is exactly how a homeowner ends up asking what’s the average payback period for a residential solar system months after installation, once the real bills start arriving.
Good Payback Period for Solar: What Does It Mean?
Good payback period for solar is context-dependent, not a fixed number. Compare it against expected system life, financing term, expected electricity savings, maintenance and replacement costs, and how long the homeowner plans to stay in the home. A good payback period for solar for one household can look mediocre for another with different assumptions. There’s no universal number that qualifies as good for every homeowner.
What Makes a Good Payback Period for Solar
It tends to mean a number well inside the equipment’s expected lifespan, with room left for years of savings afterward. Anything close to the panel warranty length deserves a second look before signing.
Recap: What Counts as a Good Payback Period for Solar
There’s no single cutoff. Most homeowners treat a result comfortably shorter than the equipment’s expected lifespan as a favorable outcome.
Payback Period by State
Solar payback by state varies for reasons that go beyond sunlight alone. Electricity prices, solar resource, incentives, utility compensation, system prices, and local property considerations all shift the number. State averages can still vary significantly between individual utilities and homes within the same state.
| Factor | Effect on Payback |
| Higher electricity rates | Can increase annual bill savings |
| Greater solar production | Can increase annual energy output |
| Lower installed cost | Reduces initial investment |
| Incentives | Can reduce net upfront cost |
| Favorable export compensation | Can increase value of excess generation |
| Financing costs | Can increase total project cost |
| Lower household electricity use | Can reduce potential savings |
State-level incentive programs can move this table considerably. Homeowners in New Jersey, for example, should look at how the SREC-II program for 2026 changes the incentive side of this calculation before assuming a national average applies to their state.
Why State Averages Do Not Equal Individual Payback
Roof orientation, shading, and system size all affect a single home’s number. Household electricity consumption and utility rate structure matter just as much. Local utility policies, actual installed price, battery inclusion, and financing terms round out the list of things a state average simply can’t capture.
Ranking Speed Across States for 2026
Which States Have the Fastest Payback Periods for Solar in 2026?
This is a question that only means something when every state gets evaluated the same way. A methodology section should come before any state comparison. States shouldn’t get ranked using inconsistent datasets. System size, installed cost, electricity rate, production, incentive, and financing assumptions all need to be stated clearly and identically across every state compared. Rankings can shift as electricity rates, incentives, and compensation policies change.
What Makes a State Recover Its Cost Faster?
High retail electricity prices, strong solar production, and lower installed costs all push a number down. Available incentives and favorable utility compensation help too. Lower system financing costs round out the list of what makes which states have the fastest payback periods in 2026 a moving target.
Why the Fastest-Payback States Can Change
Utility-rate changes, incentive expiration, and net-metering changes can all reshuffle which states have the fastest payback periods for solar in 2026 within a single year. Solar equipment prices, battery prices, and shifts in federal or state policy add more movement on top.
Calculating Your Own Payback Number
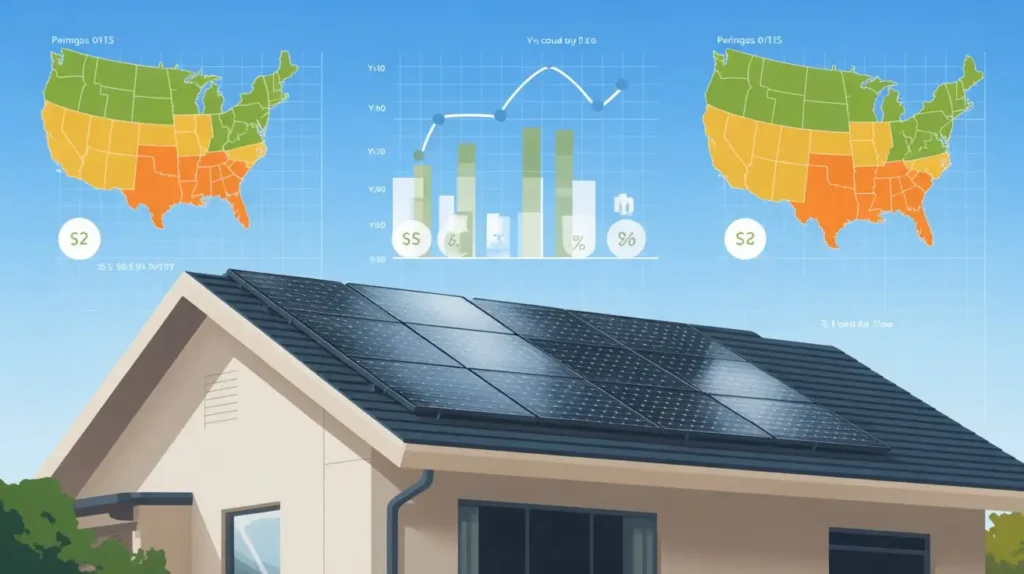
Calculating a personal payback number takes three inputs: net cost, annual savings, and a bit of patience with the math.
Step 1: Find the Total Installed Cost
As an illustrative example: a solar system price of $24,000, minus $6,000 in applicable incentives, leaves a net investment of $18,000. These numbers are for illustration only, not a quote.
Step 2: Estimate Annual Electricity Savings
Continuing the example: annual electricity savings of $2,000 against a net investment of $18,000 gives a simple calculation. $18,000 divided by $2,000 equals nine years. That’s the core of figuring out your own recovery timeline.
Step 3: Account for Changing Electricity Rates
Annual savings rarely stay perfectly identical year over year. Utility rate increases are the most common reason why. A year-by-year model is usually more realistic than assuming constant annual savings across the whole period.
Payback Period for Solar Panels: What Should Be Included?
Payback period for solar panels only means something when the inputs are consistent and complete.
Include Upfront Costs
Panels, inverter, racking, electrical work, installation, and permits all belong in this number. A battery counts too, if one is included in the system.
How Incentives Affect the Payback Period for Solar Panels
It should always use net cost, not gross cost. Tax credits, rebates, and other incentives are not interchangeable, and each reduces cost differently. Anyone factoring incentives into the math should also check whether those incentives are taxable, and a resource like this overview of whether solar incentives are taxable in the USA covers that distinction before it affects the net-cost side of the equation. Current federal and state treatment should be verified directly before publication or before relying on any number.
Include Ongoing Costs
Maintenance, monitoring, and inverter replacement, where applicable, all belong in the calculation. Battery replacement or degradation considerations matter too, when a battery is part of the system. Financing interest applies specifically to financed projects, not cash purchases.
One More Note on the Payback Period for Solar Panels
Every input above should use the same time period and the same currency basis, so nothing gets double-counted or left out by accident. Getting the payback period for solar panels right the first time saves a lot of second-guessing later.
Comparing Payback Across Financing Options
Financing changes the underlying economics of a solar purchase. Cash purchase, solar loan, lease, and PPA all produce different results for the same physical system. A loan can produce a different cash-flow profile even when the equipment performs identically. Loan interest shouldn’t be ignored when calculating a homeowner’s actual investment recovery. A closer look at solar financing options covers how these choices compare before a homeowner commits to one.
Does a Solar Loan Change the Payback Period?
Comparing system cost with and without financing reveals the real effect of interest expense. Monthly loan payments and monthly electricity savings need to be compared directly, not assumed to offset evenly. Simple system payback and household cash-flow payback are two different numbers that shouldn’t be confused with each other.
PACE Financing and the Payback Calculation
PACE loans repay through property tax assessments rather than a traditional loan structure, which changes how the payback math works. Homeowners considering this option in California specifically may want to review a PACE loan solar attorney resource before assuming it behaves like a standard solar loan.
Payback Numbers Shift With the Financing Structure
A lease or PPA can lower the barrier to entry while extending the effective payback timeline for the homeowner, since a third party often keeps the tax benefits. Comparing the same system under all four payment structures is the only fair way to see how much financing actually changes the number.
How Do I Compare Solar Payback Periods Across Different System Quotes?
It comes down to putting every quote into the same framework before comparing anything.
| Quote Factor | What to Compare |
| System size | kW |
| Total price | Gross installed cost |
| Net price | Cost after applicable incentives |
| Expected production | Annual kWh |
| Electricity rate | Current utility rate |
| Export compensation | Applicable utility terms |
| Battery | Included or excluded |
| Financing | APR and total payments |
| Warranty | Equipment and workmanship coverage |
Homeowners often skip the production estimate and focus only on price, which is exactly backward.
Why the Cheapest Solar Quote May Not Have the Shortest Payback, and How Do I Compare it Across Different System Quotes Fairly
A lower price doesn’t automatically mean higher production. Equipment sizing and roof conditions can both affect actual output. Utility compensation and financing terms can materially change total costs too. Anyone still comparing quotes after reading the price alone hasn’t finished the comparison yet. Learning how to compare it across different system quotes before signing anything is the single best way to avoid a costly mismatch. It also helps to write down how to compare it across different system quotes as a short checklist before the first sales call.
How Long Does It Take for Solar Panels to Pay for Themselves?
How long does it take for solar panels to pay for themselves is really another way of asking about investment recovery. It connects directly back to the simple payback formula. Savings continue well after the payback point is reached. System degradation and future expenses both factor into what happens next.
How Long Do Solar Panels Take to Pay for Themselves?
The relationship between annual savings and the initial investment sets the pace. An illustrative U.S. homeowner scenario might show a nine-year payback under current rates. Changing electricity rates can push that same scenario several years in either direction.
How Long Does It Take for Solar Panels to Pay for Themselves, Without a National Average
It can’t be answered with a single national figure. It requires the homeowner’s actual rate, actual quote, and actual incentives, not an average pulled from an ad.
The Short Version of How Long Does It Take for Solar Panels to Pay for Themselves
Most residential systems land somewhere between six and twelve years, though the exact figure always comes back to the household’s own numbers. Anyone still wondering how long it does take for solar panels to pay for themselves after reading a quote should ask the installer for the underlying assumptions in writing.
Solar Investment Recovery: Why Your Actual Result Can Differ From an Estimate
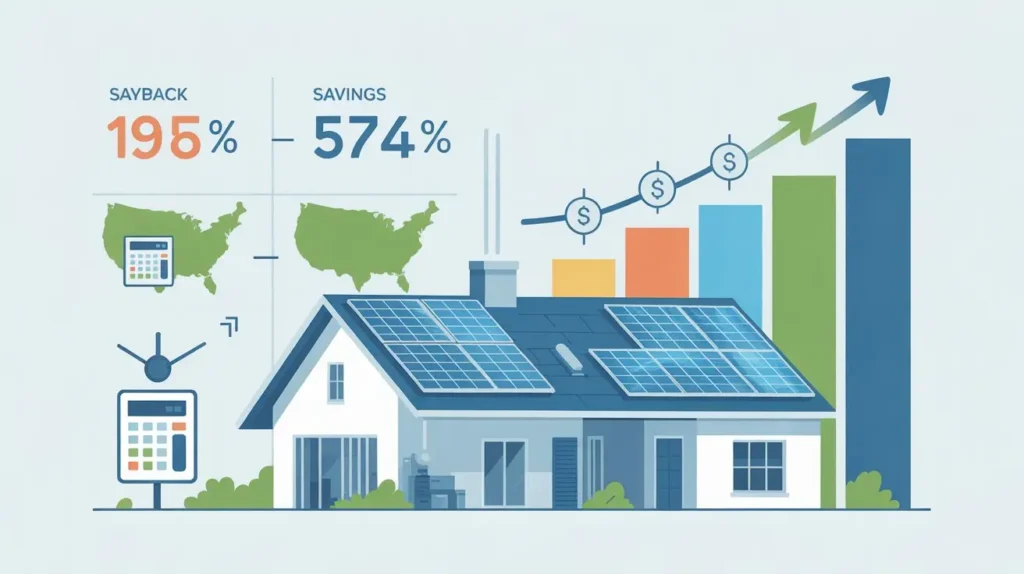
Estimated production can differ from actual production once a system is running. Electricity usage, utility rates, and export compensation can all change after installation. System performance degrades gradually over time. Repairs or component replacements can affect lifetime economics. Incentive eligibility can also differ from what was assumed at signing.
Weather and Solar Production
Seasonal production changes, cloud cover, snow where relevant, shading, and roof orientation and tilt all affect actual output compared to the original estimate.
Electricity Usage Changes
Electric vehicle adoption, heat pumps, home additions, changes in household occupancy, and energy-efficiency upgrades can all shift electricity usage after a system is installed, which changes the real-world result.
Solar Panel Payback Period vs. Solar System Lifetime
This recovery timeline should never be confused with how long the system actually lasts. Once the investment is recovered, the system keeps producing electricity for years afterward. Ongoing electricity savings continue well past that recovery point.
Degradation and eventual equipment replacement are part of that longer story too. Homeowners weighing the decision from scratch sometimes step back and ask a broader question first, and a resource like this look at whether solar panels are worth it in the USA covers that wider framing before narrowing down to payback specifically.
What Happens After the Payback Period?
Continued electricity production and ongoing utility-bill impacts persist well beyond that recovery point. Potential maintenance costs and possible inverter or battery replacement should be expected eventually. Future electricity rate changes will keep affecting the value of that production too.
Solar Panel Payback Period and Net Metering
Compensation for exported electricity can meaningfully change this calculation. Full-retail net metering is different from other compensation structures a utility might use instead. Utility-specific rules matter more than general assumptions about how net metering works. Grandfathering can also apply to existing systems even after a policy changes. One state’s net-metering policy should never be applied to the entire country when estimating this recovery timeline.
How Net Metering Can Affect This Calculation
The value of exported electricity depends on the specific compensation structure in place. Annual true-up or settlement rules, time-of-use rates, and changes in compensation policy all affect that number differently depending on the utility. Utility-specific differences make this one of the hardest variables to generalize.
Solar Panel Payback Period With Battery Storage
Adding a battery changes the initial investment behind this recovery timeline. Battery price, usable capacity, and cycling all factor into the added cost. Electricity rates, outage value, time-of-use pricing, and export compensation all affect what that battery actually returns. A battery can change that recovery timeline even when the solar array itself stays exactly the same.
How to Build a More Accurate Payback Calculation
Use Actual Utility Bills
Monthly kWh consumption and current electricity rates should come from real bills, not estimates. Demand charges and time-of-use pricing should be included where they apply.
Use Actual System Production Estimates
System size, expected annual kWh, roof orientation, shading, and location all belong in a real production estimate rather than a generic one.
Use Actual Quote Costs
Gross installed price, financing cost, battery cost, applicable incentives, and any additional electrical or roof work should all come from the actual quote, not a rough guess.
Modeling a Realistic Payback of Solar Range
Building three scenarios, lower, expected, and higher annual savings, gives a range instead of a single number presented as certain. A figure that only shows the best case isn’t a complete answer.
Why a Single Payback of Solar Number Can Mislead
Presenting a range, rather than one point estimate, is what separates a useful calculation from a sales pitch. A single payback of solar number hides how much the result depends on assumptions that can easily shift.
Putting the Payback of Solar Range to Use
Once the low, expected, and high scenarios are built, use the middle one for planning and treat the other two as bounds, not as separate promises. This scenario-based payback of solar approach also makes it easy to see how sensitive the result is to a single risky assumption, like an electricity-rate forecast that turns out too optimistic for the actual payback of solar a homeowner ends up seeing.
Common Questions About Recovering Your Solar Investment
What is a solar panel payback period? I
It’s the time it takes for electricity savings to equal what a solar system cost upfront, calculated as net cost divided by annual savings.
What is the average payback timeline for a residential system?
It typically falls in a range rather than one fixed number, since system cost, local rates, and incentives all vary by household and state.
What is a good payback period for solar?
It depends on the homeowner’s situation. A number well within the equipment’s expected lifespan, with years of savings left afterward, is generally considered favorable.
How do you calculate the payback period for solar panels?
Divide the net upfront cost, after incentives, by the estimated annual electricity savings. The result is the number of years to recover the investment.
How long does it take for solar panels to pay for themselves?
It depends on system cost, electricity rates, and incentives, but many residential systems land somewhere in the range of six to twelve years.
Does net metering affect this calculation?
Yes. How exported electricity gets valued under net metering can meaningfully speed up or slow down the payback calculation.
Does adding a battery increase the recovery timeline?
Usually yes, since a battery adds upfront cost. Its effect on payback depends on electricity rates, outage value, and how the battery is actually used.
Why can the actual result differ from an installer estimate?
Actual electricity usage, utility rates, and system production can all differ from the assumptions used in an initial estimate, changing the real-world result.
This article by SolarInfoPath (2026 research framework) is part of a comprehensive solar knowledge architecture covering all major high-value sectors including legal disputes (installation negligence, contracts, liability, fraud, lawsuits, liens, HOA and permitting disputes), financial structures (loans, PPA/lease agreements, DSCR financing, tax equity, investment and project finance), tax law (ITC, Section 48/25D, MACRS depreciation, bonus credits, IRS audits, recapture rules, domestic content and IRA/OBBBA compliance), insurance and risk (property damage, hail/wind/fire claims, bad faith insurance disputes, warranty coverage), policy and regulation (net metering, FERC interconnection, state utility rules, incentive programs and regulatory changes), commercial and utility-scale development (EPC contracts, construction delays, performance bonds, receivership, bankruptcy, asset sale and restructuring), real estate impacts (home value, solar leases, liens, title issues, HOA restrictions, easements), and emerging market structures such as battery storage, community solar, agrivoltaics, SRECs, yieldcos, and institutional investment funds. All content is based on publicly available regulatory, financial, and legal sources and is intended strictly for educational and informational purposes, not legal, tax, or financial advice. Readers should always verify current laws, utility policies, tax regulations, and contract terms with qualified licensed professionals before making decisions, as solar regulations, incentives, and financial structures frequently change across jurisdictions and time.

Solar Legal Analyst· Policy Researcher· Investigative Finance Writer Lead Analyst & Founder of SolarInfoPath
Morgan Lee is a solar legal analyst, policy researcher, and investigative finance writer with 12+ years of experience in U.S. renewable energy law, IRS tax credit compliance, and solar litigation. He is the founder of SolarInfoPath, a research-driven platform focused on primary-source analysis of solar contracts, tax law, regulatory policy, and industry disputes affecting homeowners and commercial developers.
His work is grounded in original legal and regulatory sources, including IRS notices, FERC and CPUC rulings, state court filings, PACER records, and UCC lien databases. He specializes in solar contract disputes, injury and workers’ compensation claims, PACE financing issues, tax equity structures, ITC recapture rules, MACRS depreciation, and federal and state solar policy frameworks.
Morgan’s analysis spans solar litigation, finance structures, and regulatory developments such as the IRA and OBBBA, interconnection reform, domestic content rules, and battery storage incentives. He also covers EPC contracts, PPAs, project financing, and utility-scale solar investment structures.